Super Bowl LIV Betting Info

Search

When you're broke, you Break
Joined
Apr 4, 2016
Messages
12,451
Tokens
Since 2003, dogs have held a distinct advantage in the Super Bowl going 10-6 ATS (62.5%) according to Bet Labs Sports.

Dogs have also covered by an average margin of 6.06-points. As a result, betting dogs to win straight up on the moneyline has been profitable as well. They have gone 7-9 (43.8%), but profited roughly 5 units due to the plus-money payouts.


Here is a breakdown of every Super Bowl over the past 16 years ...

2019: Patriots (-2) defeat Rams 13-3

2018: Eagles (+ 4.5) defeat Patriots 41-33

2017: Patriots (-3) defeat Falcons 34-28

2016: Broncos (+ 4.5) defeat Panthers 24-10

2015: Patriots (-1) defeat Seahawks 28-24

2014: Seahawks (+ 1.5) defeat Broncos 43-8

2013: Ravens (+ 4.5) defeat 49ers 34-31

2012: Giants (+ 3) defeat Patriots 21-17

2011: Packers (-3) defeat Steelers 31-25

2010: Saints (+ 4.5) defeat Colts 31-17

2009: Cardinals (+ 6.5) lose to Steelers 27-23 but cover

2008: Giants (+ 12.5) defeat Patriots 17-14

2007: Colts (-6.5) defeat Bears 29-17

2006: Steelers (-4) defeat Seahawks 21-10

2005: Eagles (+ 7) lose to Patriots 24-21 but cover

2004: Panthers (+ 7) lose to Patriots 32-29 but cover


Since 2003, when a line moves at least a half-point toward a team, those teams are 9-5 ATS (64.3%). This includes 5-5 ATS toward a favorite (think -3 to -3.5) and a perfect 4-0 ATS toward a dog (think + 3 to + 2.5).

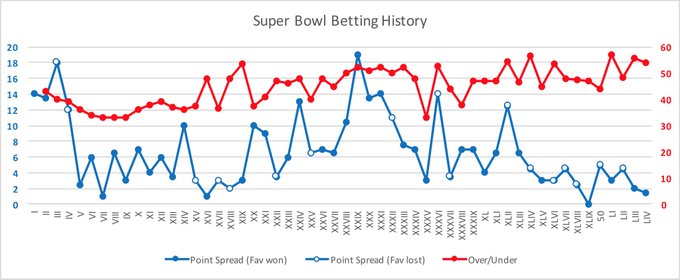
When it comes to the total, overs and unders are an even 8-8 (50%) over the past 16 Super Bowls. When the total is 50 or higher the under is 4-1 (80%).
 

When you're broke, you Break
Joined
Apr 4, 2016
Messages
12,451
Tokens
Hollywood Casino at Charles Town Races in West Virginia

Took $187,000 49ers ML (+107)
 

When you're broke, you Break
Joined
Apr 4, 2016
Messages
12,451
Tokens
Draft Kings Sportsbook

Very early, but bettors are hammering the over


90% of bets and 96% of $$ on the over (now at 54)
 

When you're broke, you Break
Joined
Apr 4, 2016
Messages
12,451
Tokens
The Chiefs are receiving the majority of early spread tickets ... The over/under has shifted, as well. Super Bowl 54 opened with a total of 51.5. More than 80% of tickets are on the over at Sports insights contributing, causing the line to increase to 54

If the pros are on the Chiefs and the over, would it be profitable to follow line movement in the Super Bowl?

To find out, Sports Insights used the Bet Labs database to analyze against the spread (ATS) and over/under line movement in Super Bowl history.


Past Super Bowl Spreads

There are 16 Super Bowls in their database and the line has moved in 14 of them. The team that has seen the line move in their direction, meaning they became bigger favorites (-1 to -3) or smaller underdogs (+6 to +4), have gone 9-5 (64%) ATS.

That is a small sample, but it fits the larger trend we see when analyzing line movement in the other rounds of the playoffs. Since 2003, in all playoff games, the team that has seen the line move in its direction has gone 77-54-4 (58.8%) ATS.

This doesn’t mean the Chiefs will cover, but history is on Kansas City’s side.


Super Bowl ... Opening Line ... Closing Line ... Line Movement


2019 (53) ... NE pick'em vs. LAR ... NE -2 ... 2

2018 (52) ... NE -6 vs. PHI ... NE -4.5 ... 1.5

2017 (51) ... NE -3 vs. ATL ... NE -3 ... 0

2016 (50) ... CAR -3.5 vs. DEN ... -4.5 ... 1

2015 (49) ... NE +2.5 vs. SEA ... NE -1 ... 3.5

2014 (48) ... DEN +1 vs. SEA ... DEN -1.5 ... 2.5

2013 (47) ... SF -5 vs. BAL ... SF -4.5 ... 0.5

2012 (46) ... NE -3.5 vs. NYG ... NE -3 ... 0.5

2011 (45) ... GB pick'em vs. PIT ... GB -3 ... 3

2010 (44) ... IND -1 vs. NO ... IND -4.5 ... 3.5

2009 (43) ... PIT -6.5 vs. ARI ... PIT -6.5 ... 0

2008 (42) ... NE -14 vs. NYG ... NE -12.5 ... 1.5

2007 (41) ... IND -6 vs. CHI ... IND -6.5 ... 0.5

2006 (40) ... PIT -3 vs. SEA ... PIT -4 ... 1

2005 (39) ... NE -6 vs. PHI ... NE -7 ... 1

2004 (38) ... NE -6.5 vs. CAR ... NE -7 ... 0.5


Past Super Bowl Over/Unders

Since 2004, when the over/under increases in the Super Bowl, the over has gone 2-2. If the total decreases, the under has gone 5-6. Combined, following the line movement whether the total increases or decreases has gone 7-8 (there was no line movement in Super Bowl 40).

These results would not encourage you to follow the over/under line movement. However, if we look at the rest of the playoffs in the same time frame to get a larger sample size, the results change.

In all playoff games since 2004, following the over/under line movement has gone 87-70-4 (55.4%). That looks promising, but all of the value came from betting the under when the line decreased in the Wild Card Round (22-7). If you remove those games, following the over/under line movement has gone 65-63-4.

A majority of bettors are on the over but the data doesn’t recommend blindly following the crowd.


Super Bowl ... Opening Line ... Closing Line ... Line Movement


2019 (53) ... 59 ... 55.5 ... 3.5

2018 (52) ... 47 ... 48.5 ... 1.5

2017 (51) ... 57.5 ... 57 ... 0.5

2016 (50) ... 45.5 ... 43 ... 2.5

2015 (49) ... 49 ... 47 ... 2

2014 (48) ... 47.5 ... 47 ... 0.5

2013 (47) ... 48.5 ... 47.5 ... 1

2012 (46 )... 54 ... 53 ... 1

2011 (45) ... 44 ... 44.5 ... 0.5

2010 (44) ... 56 ... 56.5 ... 0.5

2009 (43) ... 47 ... 46.5 ... 0.5

2008 (42) ... 55 ... 54.5 ... 0.5

2007 (41) ... 48.5 ... 47 ... 1.5

2006 (40) ... 46.5 ... 46.5 ... 0

2005 (39) ... 44 ... 47 ... 3

2004 (38) ... 38 ... 37.5 ... 0.5
 

When you're broke, you Break
Joined
Apr 4, 2016
Messages
12,451
Tokens
EO6AorPX0AE1nlr
 

When you're broke, you Break
Joined
Apr 4, 2016
Messages
12,451
Tokens
8L23aNWe


In 53 Super Bowls the winner of the coin toss has gone on to lift the Vince Lombardi Trophy 24 times (45%), losing 29 times (55%). People may argue that, based on these figures, the Super Bowl coin toss has some influence on the outcome of the game. However, even with a far greater sample size you would still struggle to justify such a statement.

One of the reasons that the Super Bowl coin toss has captured bettors’ imagination is that from 1998-2011 the NFC recorded 14 consecutive wins – that’s two to the power of 14, or decimal odds of 16,001.00. This, along with the NFC's 66% win rate in the Super Bowl coin toss (35/53), has given rise to a familiar misconception about random events such as a coin toss (people begin to believe that it isn't actually random).

Many bettors fail to see that as the coin has no memory – each flip is totally independent – and a streak over 53 coin tosses isn’t statistically significant. This is explained by the law of large numbers (something that has also been discussed in a separate article regarding the Gambler’s Fallacy).

A lack of understanding about probability amongst the general public becomes apparent when we hear of speculation about the coins being biased. Others also claim this could be possible due to the fact that they are especially made for the occasion. While this is an interesting narrative that odds to the fun of the Super Bowl, it simply isn't true.


Putting the fun element to one side, on its own, the Super Bowl coin toss is a bad bet. The odds are 50/50 and therefore should be priced at 2.0/2.0 on both sides, with zero margin. However, it's unlikely you'll find any Bookmaker offering this.
 

When you're broke, you Break
Joined
Apr 4, 2016
Messages
12,451
Tokens
According to The Action Network’s current data:

91% of the money is on Over 54
 

When you're broke, you Break
Joined
Apr 4, 2016
Messages
12,451
Tokens
Super Bowl betting history


X-Axis: Super Bowl number

Red line against right Y-Axis: Over/Under

Blue line against left Y-Axis: Point Spread


Blue circle = favorites won

White circle = underdog won


SBLIV 4th lowest spread, 5th highest over/under


EO-P8aKX4AEnqWG
 

When you're broke, you Break
Joined
Apr 4, 2016
Messages
12,451
Tokens
In the 2019 regular season, Mahomes against the blitz:

73 for 102 (72%), 900 YDS / 8.8 YPA / 7 TDs / 0 INTs / 121.7 QB rating


Playoffs against the blitz (4 games):

18 for 40 (45%) / 241 YDS / 6.0 YPA / 4 TDs / 0 INTs / 98.0 QB rating


2019 Regular Season

EO03uneXsAAq54M


Playoffs

EO03jyEWsAMD2Pv
 

When you're broke, you Break
Joined
Apr 4, 2016
Messages
12,451
Tokens
Since 2003, in playoff games when the total moved by one or more points it has been profitable to follow the line movement (increase bet over, decrease bet under):

68-49-3 (58%)
 

When you're broke, you Break
Joined
Apr 4, 2016
Messages
12,451
Tokens
PointsBet Sportsbook

The most popular prop bet at this point ... the coin flip “by a good margin.”


52% of bets are on heads ... 70% of $$ on tails
 

When you're broke, you Break
Joined
Apr 4, 2016
Messages
12,451
Tokens
CG Technology

10-1 on the over 54.5


South Point

12-1 on the over 54.5


CG Tech thinks 56 is possible


Chris Andrews at South Point says 55 will be the wiseguy money so he isn't moving yet
 

When you're broke, you Break
Joined
Apr 4, 2016
Messages
12,451
Tokens
Demi Lovato has performed the National Anthem at four major sporting events:

2011 WS Gm 5 (1:48)
2012 WS Gm 4 (1:50)
2015 WS Gm 4 (1:59)
Mcgregor vs Mayweather (2:11)

With an average performance time of 1:57


National Anthem over 127.50 seconds +145
National Anthem under 127.50 seconds -185

National Anthem over 125.50 seconds +115
National Anthem under 125.50 seconds -155

National Anthem over 123.50 seconds -135
National Anthem under 123.50 seconds -105

National Anthem over 121.50 seconds -185
National Anthem under 121.50 seconds +145
 

When you're broke, you Break
Joined
Apr 4, 2016
Messages
12,451
Tokens
The Golden Nugget bumped its number up to a city-high of 55 on Thursday

Just about every other book is at 54.5

Circa still at 54
 

When you're broke, you Break
Joined
Apr 4, 2016
Messages
12,451
Tokens
In-Game Betting Cheat Sheet


First team to score

Super Bowl History

The team that scored first has won eight of the last nine and ten of the last 12 Super Bowls.

The team that scored first has won 67.9% of the time (36-17).

When the first score was a TD (25 times), the team won 68.0% of the time (17-8).

When the first score was a FG (25 times), the team won 64.0% of the time (16-9).

When the first score was a safety (3 times), the team won 100% of the time (3-0).


Team ... When Scoring First ... When Not Scoring First

49ers ... 9-3 SU (+14) ... 6-0 SU (+5.83)

Chiefs ... 6-3 SU (+9.44) ... 8-1 SU (+9.89)


End of First Quarter

Super Bowl History

The team leading at the end of the first quarter has won 71.8% of the time, including the last six Super Bowls and eight of the last nine Super Bowls.

No team leading by more than 10 points at the end of the first quarter has EVER lost a Super Bowl.

Teams that had a lead at the end of the first quarter have won 6 straight Super Bowls. (note this does not include years when the score was tied at the end of the 1st quarter)

Teams that are scoreless at the end of the first quarter and whose opponents are not are 6-20 SU (23.1%).

Teams leading by less than seven points at the end of the first quarter are 11-7 SU (61.1%).

Teams leading by seven points or more at the end of the first quarter are 17-4 SU (81.0%).

Teams leading by three points or less at the end of the first quarter are 8-5 SU (61.5%).

Teams leading by more than three points at the end of the first quarter are 20-6 SU (76.9%).


Team ... Leading at End of 1st Quarter ... Not Leading at End of 1st Quarter

49ers ... 7-1 SU (+19) ... 4-0 SU (+4.75)

Chiefs ... 6-2 SU (+14) ... 7-2 SU (+6.56)


HalfTime

Super Bowl History

The team leading at halftime has won 78.0% of the time (39-11 SU).

Only one team leading by more than seven points at halftime has EVER lost a Super Bowl (Falcons vs Patriots).

No team has EVER come back to win when held scoreless in the first half.

Teams leading by three points or less at half have lost five of nine times.

Teams leading by four points or less at half have lost seven out of 14 times.


Team ... Leading at Halftime ... Not Leading at Halftime

49ers ... 10-1 SU (+14.82) ... 3-1 SU (+6.25)

Chiefs ... 12-1 SU (+14.08) ... 0-2 SU (-6.50)


End of Third Quarter

Super Bowl History

The team leading at the end of the third quarter has won 80.4% of the time.

Teams leading by seven points or more at the end of the third are 33-4.

Teams leading by three points or less at the end of the third quarter have only won the Super Bowl once (1-4).

Teams leading by more than three points at the end of the third are 40-6.

Teams leading by less than seven points at the end of the third quarter are 8-6.


Team ... Leading at End of 3rd Quarter ... Not Leading at End of 3rd Quarter

49ers ... 13-1 SU (+14.00) ... 2-1 SU (+3.33)

Chiefs ... 13-2 SU (+12.20) ... 1-1 SU (-1)


Season Scoring Averages

49ers

Quarter ... Average Points Scored ... Average Points Allowed

1st ... 6.67 ... 4.06

2nd ... 9.00 ... 4.33

3rd ... 3.72 ... 4.61

4th ... 7.33 ... 5.72


Chiefs

Quarter ... Average Points Scored ... Average Points Allowed

1st ... 5.39 ... 6.17

2nd ... 12.17 ... 4.28

3rd ... 6.44 ... 3.56

4th ... 5.83 ... 6.17
 

Forum statistics

Threads
1,109,583
Messages
13,460,986
Members
99,483
Latest member
joseth1n
The RX is the sports betting industry's leading information portal for bonuses, picks, and sportsbook reviews. Find the best deals offered by a sportsbook in your state and browse our free picks section.FacebookTwitterInstagramContact Usforum@therx.com