You are using an out of date browser. It may not display this or other websites correctly.
You should upgrade or use an alternative browser.
You should upgrade or use an alternative browser.
Pulled all my money out of the stockmarket today
- Thread starter kidman232
- Start date
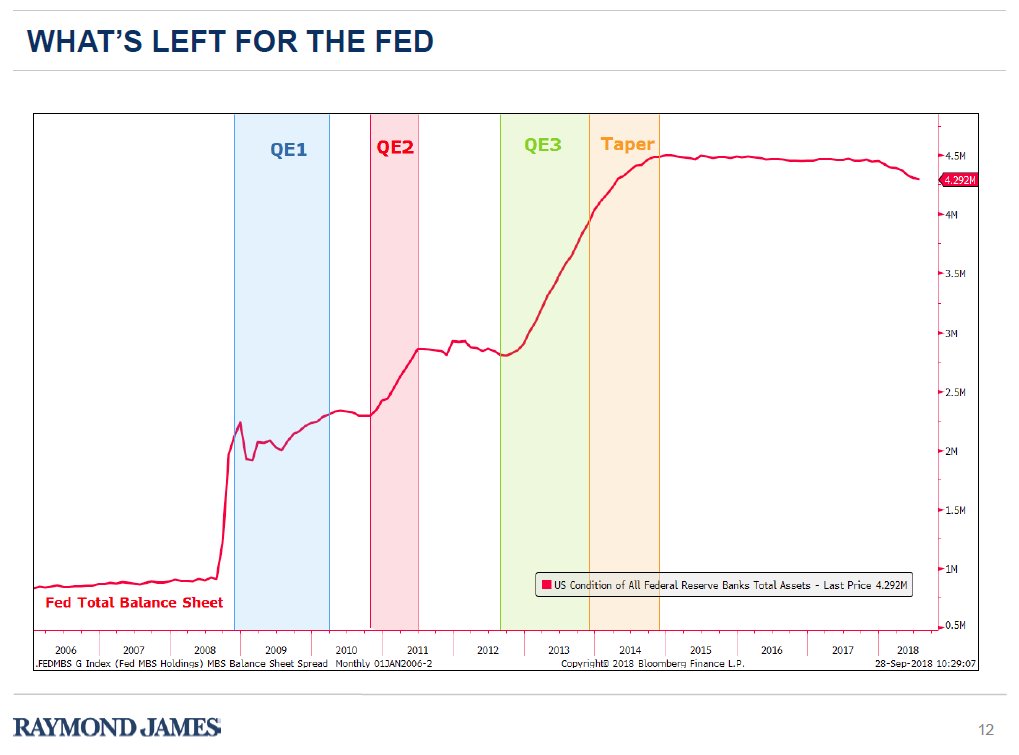
Just getting started. The Fed is on a mission to raise rates and sell off its balance sheet, and as you see in the chart above, they haven't even made a dent in the portfolio yet . Normalization with a 21.5 trillion dollar debt to finance is not a good scenerio, especially as the economy slows, which it will
First look at third qtr GDP tomorrow
GDP Tracking Estimates, annualized % change
| Consensus | 2018 Q3 | |
|---|---|---|
| Median | 3.3 | |
| Low and highest median estimates to date | 3.1 to 3.5 | |
| Average | 3.3 | |
| # of Estimates | 13 |
<tbody>
</tbody>
bruce, ya nailed it(<)<. Blame gun is pointed, and loaded;
President Trump escalated his attacks on Federal Reserve Chairman Jerome Powell, saying the head of the nation’s central bank threatens U.S. economic growth and appears to enjoy raising interest rates.
In an interview Tuesday with the Wall Street Journal, Trump acknowledged the independence the Fed has long enjoyed in setting economic policy, while also making clear he was intentionally sending a direct message to Powell that he wanted lower interest rates.
“Every time we do something great, he raises the interest rates,” Trump said, adding that Mr. Powell “almost looks like he’s happy raising interest rates.” The president declined to elaborate, and a spokeswoman for the Fed declined to comment.
:missingte................... TREMENDOUS theatre
................
huge huge huge day next Thursday. Apple reports. The markets are overly sensitive to the downside (given major resistance levels have been breached) as we saw today with amzn and goog disappointing . Incredible volatility in the markets, October living to its reputation
since 1945 for the SPY;
4th qtr: +4.1% (nearly double any other qtr)
4th qtr : (in mid-yr election yrs) +7.7%
hmm.....either this is going to an outlier year or we will see one hell of a yr end rally
my 2 cents
SPY
3 yr weekly

basically a 10% correction (historically occurs once every 26 months). For long term investors, adding on the dips always a smart move (Unless you believe the story is over for USA, in that case buy land in Iowa, and a LOT of ammo). Forms a bearish engulfing pattern on higher vol. Look at the long red candle in Feb- the following week did NOT form a closing lower low, need this bare minimum. Careful pulling the trigger early in the week, esp with AAPL on thurs reporting (short term trading)
SPY
1 yr daily

a doji (indecision) on massive volume. Below the 50,200 and 8 ema..um, no can do.......lets see what next week brings. With great volatility comes opportunity .
SPY
3 yr weekly
basically a 10% correction (historically occurs once every 26 months). For long term investors, adding on the dips always a smart move (Unless you believe the story is over for USA, in that case buy land in Iowa, and a LOT of ammo). Forms a bearish engulfing pattern on higher vol. Look at the long red candle in Feb- the following week did NOT form a closing lower low, need this bare minimum. Careful pulling the trigger early in the week, esp with AAPL on thurs reporting (short term trading)
SPY
1 yr daily
a doji (indecision) on massive volume. Below the 50,200 and 8 ema..um, no can do.......lets see what next week brings. With great volatility comes opportunity .
Bruce, you selling ERI?
That stock will be $10 a share if half the market carnage you think is going to happen ends up coming to fruition.
Good question. It is hard to be a long term holder of anything but quality names like ERI will comeback . The problem with the gambling group right now is the debt the carry with rates rising. Eri was able to refi into mostly fixed rates ,and I believe Nevada growth will be very strong regardless . Vegas properties may be much more susceptible to a slowdown
Got stopped out on some in my margin acct to protect the acct. Also hedged with ETFs like FAZ, and TZA, and in retirement accts, and sold some calls against my position
Watching close
Like many, lots a of technical damage has been done , but earnings and conference call next week I believe
i enjoy this stuff MIch, enjoy sharing my thoughts.
many ways to skin a cat, all depends on what one is comfortable with. Some folks wont touch equities, Brick and Mortar. Like my parents, landed immigrants- lives off the rent of properties he owns. Owns ZERO stocks, never has. Anyway, Brucefan said ;
``Got stopped out on some in my margin acct to protect the acct.``
there is evidence to support this technique, and for those that feel a major correction is on the horizon, is certainly the way to go. Let`s keep in mind we are on a stupid run- longest bull market in history. And 2017 was an outlier; ONLY 1 month on the SPY was negative, lol. MASSIVE fuel was poured onto the markets; large deficit spending and MASSIVE corp tax cuts (35% to 21% is indeed massive). Unfortunately, the equity party is showing breaks (inflation, trade wars, rising interest rates AND rising deficits) perhaps a slow down for equities is on the horizon........J Bogle mentioned in 2016 that he felt the next decade would yield on AVERAGE 4% per year for SPY. Yikes.
SPY
1 decade daily
posted the 200 SMA ............ a HUGE support level used by portfolio managers, algorithms, traders, grandmothers....etc
one way to protect from a major correction (see 2008) is have a stop loss below it. If triggered you are out . Get back in when it CLOSES above it. Done.

pity 2008 is not seen on the graph, lol. By the way this has been back-tested abd beats the index. Think someone wrote on a book on this simple technique
many ways to skin a cat, all depends on what one is comfortable with. Some folks wont touch equities, Brick and Mortar. Like my parents, landed immigrants- lives off the rent of properties he owns. Owns ZERO stocks, never has. Anyway, Brucefan said ;
``Got stopped out on some in my margin acct to protect the acct.``
there is evidence to support this technique, and for those that feel a major correction is on the horizon, is certainly the way to go. Let`s keep in mind we are on a stupid run- longest bull market in history. And 2017 was an outlier; ONLY 1 month on the SPY was negative, lol. MASSIVE fuel was poured onto the markets; large deficit spending and MASSIVE corp tax cuts (35% to 21% is indeed massive). Unfortunately, the equity party is showing breaks (inflation, trade wars, rising interest rates AND rising deficits) perhaps a slow down for equities is on the horizon........J Bogle mentioned in 2016 that he felt the next decade would yield on AVERAGE 4% per year for SPY. Yikes.
SPY
1 decade daily
posted the 200 SMA ............ a HUGE support level used by portfolio managers, algorithms, traders, grandmothers....etc
one way to protect from a major correction (see 2008) is have a stop loss below it. If triggered you are out . Get back in when it CLOSES above it. Done.
pity 2008 is not seen on the graph, lol. By the way this has been back-tested abd beats the index. Think someone wrote on a book on this simple technique
know of a guy that`s retired. HATED being in healthcare. Saved like a beast , read everything in investing, fired his advisor so he can save the % of aum. He`s 65 now. Has at least 5 mill liquid. His portfolio allocation is 15 % equities 85% fixed. He basically is living on the yield of his portfolio- just ideal, i mean kudos, relax, be grateful, enjoy life........No word of a lie-- he frets when the market is down. Unbelievable. He doesnt even NEED the 15% in equities.
the mind is a beautiful thing
the mind is a beautiful thing
GLD... off the lows
yupper. Posted this chart in August as it was showing a hammer pattern on the monthly setting up for a possible swing low. Sept did not form a lower low , a good thing, ended with an indecision candle, and no red candle.., oct has arrived with a firm decision by investors, lol a break (and close) ABOVE the hammer high of Aug is bullish (right now green light)...look at the volume for Oct. (disclaimer - i dont own it)
GLD
One decade monthly
agreed
to gauge if prices are stretched (in either direction, which aids in buying and selling decisions) is if price is getting too far from the 20 SMA (and 8 EMA). Add other factors to increase probability of a short term price forecast such as ; stupid oversold or overbought...a bounce from a support or resistance level .... a bullish or bearish candlestick.
IWM
1 yr daily (20 SMA superimposed)

look how far the price is from its 20 SMA; acts like a rubber band. In addition as you noted its stupid oversold, below 20. Thursday`s candle was a bullish hurami. Friday a doji, . Doji`s at a bottom or top can often act as pivot points. A GENERAL rule for a doji in such a spot is ; the price will move in the direction it opens
in addition, the VIX did not take out its oct highs last week (VIX is contrarian to the SPY)
DIA, IWM, SPY all closed friday with Dojis
expecting wild action this week.
USD formed a bearish engulfing pattern Friday (UUP), this would be good for commodities. It was NOT on higher volume tho
to gauge if prices are stretched (in either direction, which aids in buying and selling decisions) is if price is getting too far from the 20 SMA (and 8 EMA). Add other factors to increase probability of a short term price forecast such as ; stupid oversold or overbought...a bounce from a support or resistance level .... a bullish or bearish candlestick.
IWM
1 yr daily (20 SMA superimposed)
look how far the price is from its 20 SMA; acts like a rubber band. In addition as you noted its stupid oversold, below 20. Thursday`s candle was a bullish hurami. Friday a doji, . Doji`s at a bottom or top can often act as pivot points. A GENERAL rule for a doji in such a spot is ; the price will move in the direction it opens
in addition, the VIX did not take out its oct highs last week (VIX is contrarian to the SPY)
DIA, IWM, SPY all closed friday with Dojis
expecting wild action this week.
USD formed a bearish engulfing pattern Friday (UUP), this would be good for commodities. It was NOT on higher volume tho


