US Auto Parts to Participate in the 30th Annual ROTH Conference on March 12, 2018[FONT=wf_segoe-ui_normal] (PR Newswire)[/FONT]
You are using an out of date browser. It may not display this or other websites correctly.
You should upgrade or use an alternative browser.
You should upgrade or use an alternative browser.
Prts ,
- Thread starter brucefan
- Start date
U.S. Auto Parts Reports Fourth Quarter and Full Year 2017 Results

PR NewswireMarch 8, 2018
CARSON, Calif., March 8, 2018 /PRNewswire/ -- U.S. Auto Parts Network, Inc. (PRTS), one of the largest online providers of aftermarket automotive parts and accessories, reported results for the fourth quarter and fiscal year ended December 30, 2017. All information and data are from continuing operations, which exclude the AutoMD operating segment unless specifically noted.
Fourth Quarter 2017 Summary vs. Year-Ago Quarter
"In Q4, our continued focus on profitability led to another double-digit increase in adjusted EBITDA, as well as the highest gross margin quarter in 2017," said Aaron Coleman, CEO of U.S. Auto Parts. "Throughout 2017, we experienced a shift in channel mix with our online marketplaces gaining significant momentum which has been offset by a decrease in our e-commerce channel. To address the channel mix trends we managed expenses to maintain profitability and developed a strategy to improve the customer experience and re-accelerate e-commerce sales."
"We have deployed a number of customer experience initiatives in the first quarter which have recently resulted in a material impact on conversion. We are encouraged by these recent trends as they reinforce our customer experience strategy and we expect to roll out similar initiatives across all of our key sites in 2018. In addition, we are excited about the growing opportunity in the marketplace channels to expose our value proposition to new customers."
Fourth Quarter 2017 Financial Results
Net sales in the fourth quarter of 2017 were $68.5 million down 4% compared to $71.1 million in the year-ago quarter. The decrease was largely driven by an 18% decrease in e-commerce sales, partially offset by a 26% increase in online marketplace sales to $24.5 million.
Gross profit in the fourth quarter of 2017 was $20.8 million compared to $21.4 million in the year-ago quarter. As a percentage of net sales, gross profit increased 20 basis points to 30.3% compared to 30.1%. The increase in gross profit margin was primarily driven by a higher mix of private label sales, which was 72% of net sales compared to 68% in the year-ago quarter.
Total operating expenses in the fourth quarter decreased 5% to $20.2 million compared to $21.3 million in the year-ago quarter. As a percentage of net sales, operating expenses decreased 50 basis points to 29.4% compared to 29.9% in the year-ago quarter primarily as a result of lower call center and marketing expenses.
Net loss in the fourth quarter was $4.1 million, or $(0.12) per share, compared to a net loss of $0.2 million, or $(0.01) per share in the year-ago quarter. The $4.1 million net loss for the quarter included a $4.2 million income tax expense due to the change in the valuation allowance in addition to the impacts of the Tax Cuts and Jobs Act.
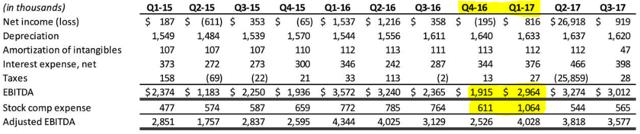
Adjusted EBITDA in the fourth quarter of 2017 increased 10% to $2.8 million, compared to $2.5 million in the same period of 2016, primarily driven by the aforementioned increase in gross margin and judicious cost management.
At December 30, 2017, cash and cash equivalents totaled $2.9 million compared to $2.7 million at December 31, 2016. The Company also had no revolver debt at each of December 30, 2017 and December 31, 2016.
Key Operating Metrics
[/COLOR]
Full Year Financial Results
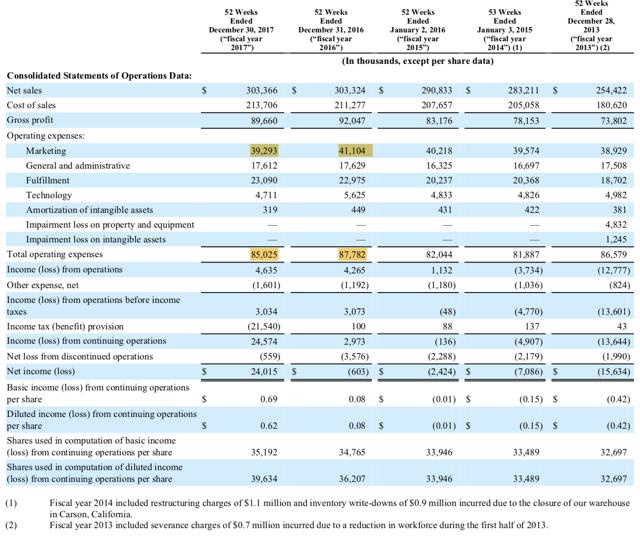
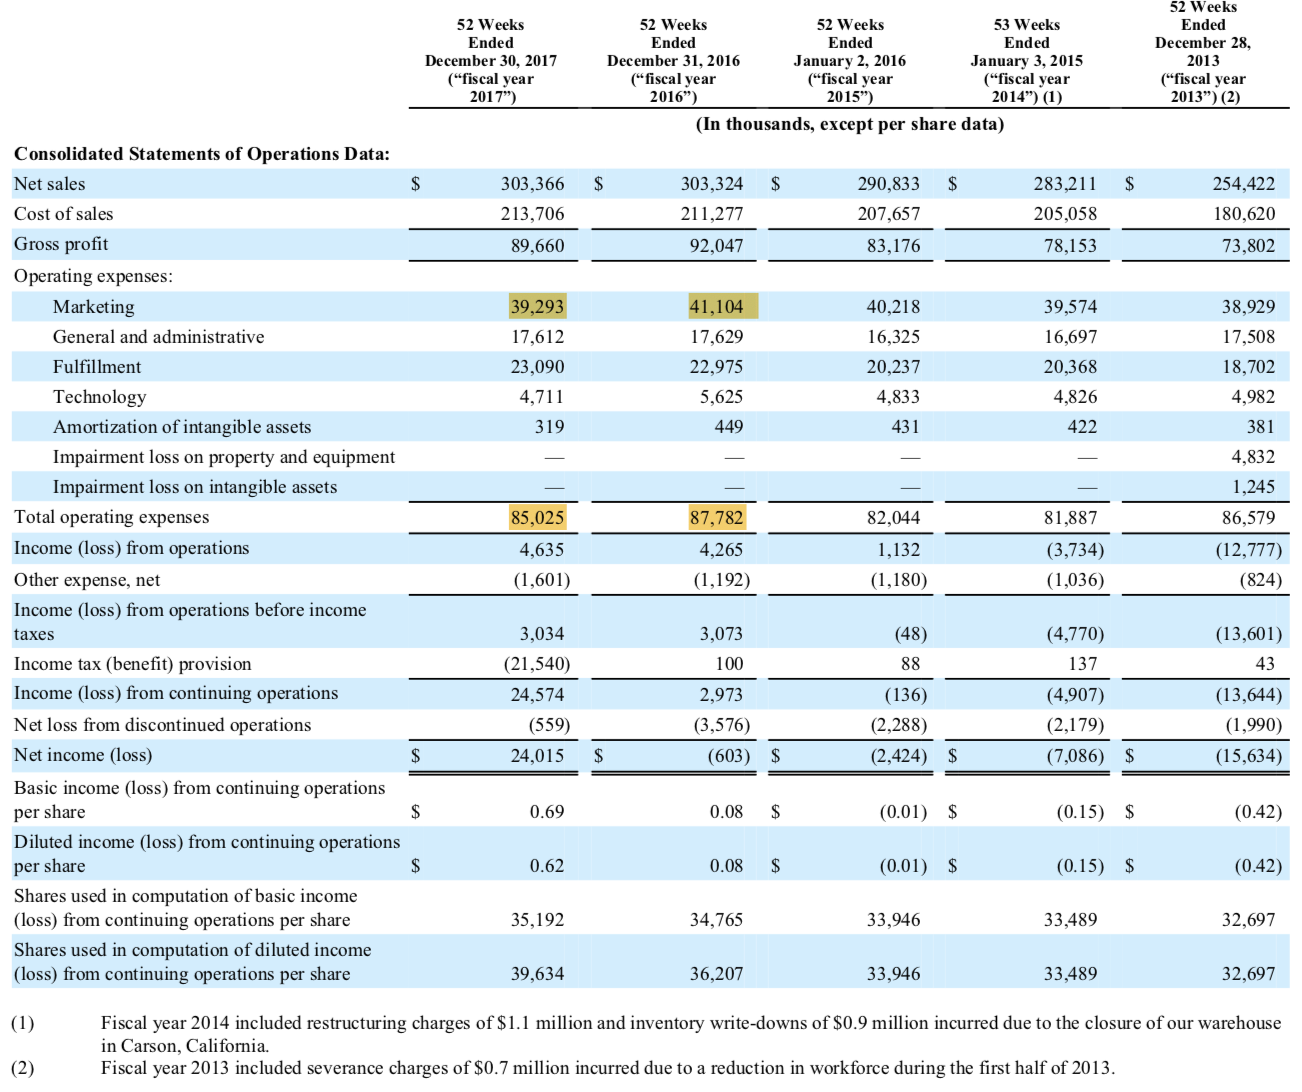
Net sales in 2017 increased to $303.4 million compared to $303.3 million in 2016.
Gross profit in 2017 was $89.7 million compared to $92.0 million in 2016. As a percentage of net sales, gross profit decreased 70 basis points to 29.6% compared to 30.3%.
Total operating expenses in 2017 decreased to $85.0 million compared to $87.8 million in 2016. As a percentage of net sales, operating expenses were 28.1% compared to 29.0%.
Net income in 2017 increased significantly to $24.6 million, or $0.62 per diluted share, compared to net income of $3.0 million, or $0.08 per diluted share in 2016. The $24.6 million net income for the year included a $21.5m income tax benefit due to the change in valuation allowance in addition to the impacts of the Tax Cuts and Jobs Act.
Adjusted EBITDA in 2017 was $14.2 million compared to $14.0 million in 2016. As a percentage of net sales, adjusted EBITDA was 4.7% compared to 4.6%.
2018 Outlook
U.S. Auto Parts continues to expect net sales to increase low single digits on a percentage basis compared to 2017. The company also expects adjusted EBITDA to range between $14.5 million and $16.0 million compared to $14.2 million in 2017. U.S. Auto Parts is not including a reconciliation of adjusted EBITDA guidance to projected net income due to the high variability and difficulty in making accurate long-term forecasts and projections of net operating loss carryforwards which have a significant impact on future net income results. As a result, U.S. Auto Parts is unable to quantify its projected net income without unreasonable efforts.https://finance.yahoo.com/news/u-auto-parts-reports-fourth-210100476.html
PR NewswireMarch 8, 2018
CARSON, Calif., March 8, 2018 /PRNewswire/ -- U.S. Auto Parts Network, Inc. (PRTS), one of the largest online providers of aftermarket automotive parts and accessories, reported results for the fourth quarter and fiscal year ended December 30, 2017. All information and data are from continuing operations, which exclude the AutoMD operating segment unless specifically noted.
Fourth Quarter 2017 Summary vs. Year-Ago Quarter
- Net sales were $68.5 million compared to $71.1 million.
- Gross margin increased 20 basis points to 30.3%.
- Net loss was $4.1 million or $(0.12) per share, compared to a net loss of $0.2 million or $(0.01) per share.
- Adjusted EBITDA (a non-GAAP measure defined below) increased 10% to $2.8 million.
- Conversion rate increased 20 basis points to 2.1% versus year-ago quarter
- Customer acquisition cost decreased 7% to $7.14
- Net sales were $303.4 million compared to $303.3 million.
- Gross margin was 29.6% compared to 30.3%.
- Net income increased to $24.6 million, or $0.62 per diluted share, compared to net income of $3.0 million, or $0.08 per diluted share.
- Adjusted EBITDA increased to $14.2 million compared to $14.0 million.
- Total online orders increased 6% to 3,632,000 orders.
"In Q4, our continued focus on profitability led to another double-digit increase in adjusted EBITDA, as well as the highest gross margin quarter in 2017," said Aaron Coleman, CEO of U.S. Auto Parts. "Throughout 2017, we experienced a shift in channel mix with our online marketplaces gaining significant momentum which has been offset by a decrease in our e-commerce channel. To address the channel mix trends we managed expenses to maintain profitability and developed a strategy to improve the customer experience and re-accelerate e-commerce sales."
"We have deployed a number of customer experience initiatives in the first quarter which have recently resulted in a material impact on conversion. We are encouraged by these recent trends as they reinforce our customer experience strategy and we expect to roll out similar initiatives across all of our key sites in 2018. In addition, we are excited about the growing opportunity in the marketplace channels to expose our value proposition to new customers."
Fourth Quarter 2017 Financial Results
Net sales in the fourth quarter of 2017 were $68.5 million down 4% compared to $71.1 million in the year-ago quarter. The decrease was largely driven by an 18% decrease in e-commerce sales, partially offset by a 26% increase in online marketplace sales to $24.5 million.
Gross profit in the fourth quarter of 2017 was $20.8 million compared to $21.4 million in the year-ago quarter. As a percentage of net sales, gross profit increased 20 basis points to 30.3% compared to 30.1%. The increase in gross profit margin was primarily driven by a higher mix of private label sales, which was 72% of net sales compared to 68% in the year-ago quarter.
Total operating expenses in the fourth quarter decreased 5% to $20.2 million compared to $21.3 million in the year-ago quarter. As a percentage of net sales, operating expenses decreased 50 basis points to 29.4% compared to 29.9% in the year-ago quarter primarily as a result of lower call center and marketing expenses.
Net loss in the fourth quarter was $4.1 million, or $(0.12) per share, compared to a net loss of $0.2 million, or $(0.01) per share in the year-ago quarter. The $4.1 million net loss for the quarter included a $4.2 million income tax expense due to the change in the valuation allowance in addition to the impacts of the Tax Cuts and Jobs Act.
Adjusted EBITDA in the fourth quarter of 2017 increased 10% to $2.8 million, compared to $2.5 million in the same period of 2016, primarily driven by the aforementioned increase in gross margin and judicious cost management.
At December 30, 2017, cash and cash equivalents totaled $2.9 million compared to $2.7 million at December 31, 2016. The Company also had no revolver debt at each of December 30, 2017 and December 31, 2016.
Key Operating Metrics
[/COLOR]
Full Year Financial Results
Net sales in 2017 increased to $303.4 million compared to $303.3 million in 2016.
Gross profit in 2017 was $89.7 million compared to $92.0 million in 2016. As a percentage of net sales, gross profit decreased 70 basis points to 29.6% compared to 30.3%.
Total operating expenses in 2017 decreased to $85.0 million compared to $87.8 million in 2016. As a percentage of net sales, operating expenses were 28.1% compared to 29.0%.
Net income in 2017 increased significantly to $24.6 million, or $0.62 per diluted share, compared to net income of $3.0 million, or $0.08 per diluted share in 2016. The $24.6 million net income for the year included a $21.5m income tax benefit due to the change in valuation allowance in addition to the impacts of the Tax Cuts and Jobs Act.
Adjusted EBITDA in 2017 was $14.2 million compared to $14.0 million in 2016. As a percentage of net sales, adjusted EBITDA was 4.7% compared to 4.6%.
2018 Outlook
U.S. Auto Parts continues to expect net sales to increase low single digits on a percentage basis compared to 2017. The company also expects adjusted EBITDA to range between $14.5 million and $16.0 million compared to $14.2 million in 2017. U.S. Auto Parts is not including a reconciliation of adjusted EBITDA guidance to projected net income due to the high variability and difficulty in making accurate long-term forecasts and projections of net operating loss carryforwards which have a significant impact on future net income results. As a result, U.S. Auto Parts is unable to quantify its projected net income without unreasonable efforts.https://finance.yahoo.com/news/u-auto-parts-reports-fourth-210100476.html
I picked up some more at $1.75.
why? why did you add to a losing position? do you feel 'it's too low, it must go higher"? 'are you an insider ?
am curious
prts
2 yr daily (this means - price performance over the last two yrs and each day's action is represented by a candlestick......am defining in case a reader isnt aware)
this is called a 'shit show'. Once it broke $2.50 you were in BIG trouble. It's in free fall until buyers come in and say i want a piece. and form some form of support; 'we will not let it go lower. ' It's at a 52 week low and the sellers have control.
If you bought cause you feel this is a great long term story? cool. But your entry point to add , techinically, is terrible. yesterday's hammer was good.
?
gl
Yes, agree with Ricboff that no STT should be buying the stock here. Chart broke down again and to me, that just means this continues to frustrate me, and will take more time . That being said, I am long term investor, and still hold 75 % of my original position, and will add more once we stabilize and we see either higher , or lower prices from here.
Institutional interest is hard to keep in a stock that trades this low, but I believe that large holders are working with the company and good things will happen here . This company is dirt cheap , has no LT debt. and I still believe will be acquired . Earnings are coming again in a few weeks, and I would look for a renewed commitment being made to buyback more stock, which will help
Trying my patience for sure, but Im not selling
[FONT=wf_segoe-ui_normal]U.S. Auto Parts Network Launches Progressive Web App from Mobify with Speedier Load Times and Friction-Free Checkout [/FONT]https://finance.yahoo.com/news/u-au...s-200100865.html?soc_src=social-sh&soc_trk=ma
[FONT=wf_segoe-ui_normal]U.S. Auto Parts Network Launches Progressive Web App from Mobify with Speedier Load Times and Friction-Free Checkout [/FONT]https://finance.yahoo.com/news/u-au...s-200100865.html?soc_src=social-sh&soc_trk=ma
This is PRTS Newly Launched - "MOBILE" / I-PHONE - Web Application
You can see this new web application directly at ==> https://www.carparts.com.
This is very likely the "Speediest" -&- Leading Edge mobile application for car parts in North America
It is 100% focused on procuring "NEW MOBILE CUSTOMERS" for the purchase of Aftermarket Auto Parts
PRTS spent the past 12 months on this project -&- Funded the Endeavor ==> 100% out of Free Cash Flow
PRTS has a database of "Tens of Millions" of previous customers to now market this (PWA) at
CFO Watanabe is "extremely excited" about this opportunity....
It looks to be a solid => DIAL MOVER !
U.S. Auto Parts Network: A Compelling Investment In The Right Hands
Apr. 30, 2018 2:19 PM ET |
About: U.S. Auto Parts Network, Inc. (PRTS), Includes: AAP, AZO, ORLY

DTF Capital
Long only, value, small-cap, mid-cap
Summary
Improving outlook coming from better product sales mix.
High OPEX can be slashed, management has done a poor job in marketing, however, it is fixable.
Shares' selling pressure is overdone as its largest investor's divestment looks completed.
Risks in website's traffic decline and low conversion are not as bad as it seems.
A compelling investment in the aftersales auto industry.
This is a two-part analysis of U.S. Auto Parts Network Inc. (PRTS). Part I lays out the background and fundamental analysis and Part II lays out a more speculative scenario where PRTS is proposed as a potential acquisition target.
Investment Thesis
U.S. Auto Parts Network, Inc., "PRTS" is a pure online retailer of three types of auto parts, collision, engines and performance.
Quick financial facts (as of April 27, 2018):
Share price: $1.92
Market cap: $67M
Number of common stock outstanding: 34.8M (10-K, March 9, 2018)
The company was founded in 1995, and since it went public in 2007, the company’s sales have doubled, but profitability remains low, at 1.5% of sales. Its marketing execution has been poor as it spent double the amount of the industry average yet its website traffic, and conversions have been unimpressive. The auto industry and the ‘Do-It-Yourself’ auto repair segment, in particular, has been “peaking” which has put further strain on US Auto Parts Network’s effort to move forward.
As a result, around the middle of 2017, its biggest and one of its earliest investors while the company was private in 2004, Oak Investment announced it would distribute all of its 28% stake to its limited partners. Investors got spooked, and PRTS’s stock price slid from $4, or $140M market cap to $1.92, or $67M market cap (as of 27th April 2018).
We believe the sales pressure should be finished as its outlook has continued to improve and it’s likely that most of the limited partners have divested the shares. We outline three reasons why PRTS is a good investment.
First, on the fundamental aspect, there are many things to like. The company has only generated FCF three times in the last ten years; two of those were in previous two years. FCF will continue in the future and has a high chance of improving as we expect the higher margin private label products will expand. In fact, we expect that FCF can be doubled as CAPEX will be minimal and its hefty marketing cost can be slashed in half fairly easily.
Secondly, before the sales of Oak Investment’s stake, the market was valuing the company between $3-$4/share, a $100M-$140M market cap. Fundamentally, nothing has changed since. The fact that we see ways that the company's bottom line can improve makes the current share price more puzzling. Thus, the opportunity to invest becomes more evident as the market continues to be cautious even as the selling pressure fizzles out.
Lastly, given the consolidation in the aftersales market by Icahn’s empire and Amazon’s (NASDAQ:AMZN) Car parts reach, PRTS could also be an accretive acquisition for companies with a large presence in brick and mortar but lacks the online footprint that PRTS commands. Part II of the analysis will expand on this.
The fact is PRTS is almost debt-free, generates FCF and has growth opportunities (fixable problems); it doesn’t need to perform fantastically to deserve a higher valuation. Nevertheless, investors will need to be incredibly patient and risk seeking to see PRTS’s stock price to appreciate to $4. This is a 100% upside opportunity.
Before we dive into the details, it would be wrong not to mention that investing in PRTS might not be a good idea.
First, PRTS’s credential to improve its operation is poor. Its net margin has not surpassed 2.4% since it went public and is currently at 1.5%, and despite favourable industry trajectory, its websites’ traffic has declined. We have reason to believe this risk is actually not as bad as it looks, which we will explain later in the analysis.
Secondly, a quick comparison with the auto parts industry leader, AutoZone (AZO), makes PRTS look incredibly bad. Over the last 10 years, like PRTS, AutoZone also doubled its sales, but has grown more efficiently and profitably, currently operating at 50%+ gross margin, 17%+ net margin and 10% FCF margin, compared to 29%, 1.5% and 2% respectively at PRTS!
So why should you consider PRTS? Let’s dig in!
Detailed Analysis
The following sections will be a deep dive into the positives and negatives of investing in PRTS. That will be followed by our fundamentals review of the company, and lastly, we will demonstrate why PRTS should be an attractive acquisition target.
I. Company background
Founded in 1995, US Auto Parts Network is an online aftermarket auto-parts retailer of cheap and easy-to-upgrade auto parts and accessories. To date, the company amassed huge stock keeping units (SKUs) to over 1M parts, subdivided into three categories: collision, engine and performance.

Source: PRTS 10K, 2017, sales mix
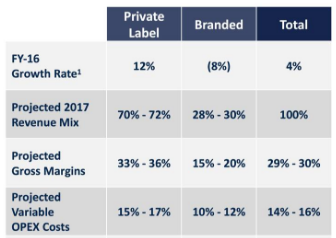
Of the 1M SKUs, 55k SKUs are private label; they have a higher gross margin (33%-36%), as they are sourced from Asia and are cheaper to make. The remaining SKUs are branded products, which carry lower margin (15%-20%) and are sourced from the US.
Source: PRTS’s Presentation at the Nobel Financial Capital Markets Conference
The online platform allows it to offer double the amount of some of its direct competitors, for example, Parts Authority (500K SKUs), and even higher than the industry leader, AutoZone (750k SKUs).
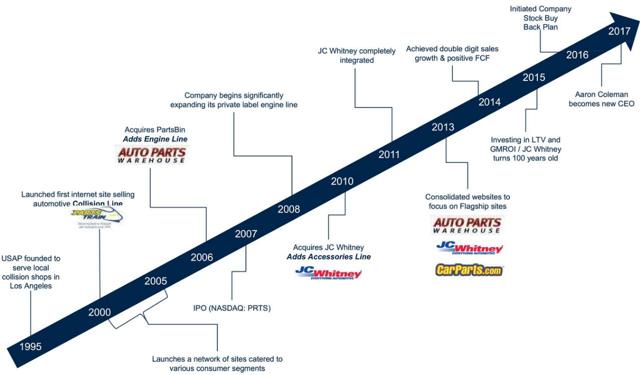
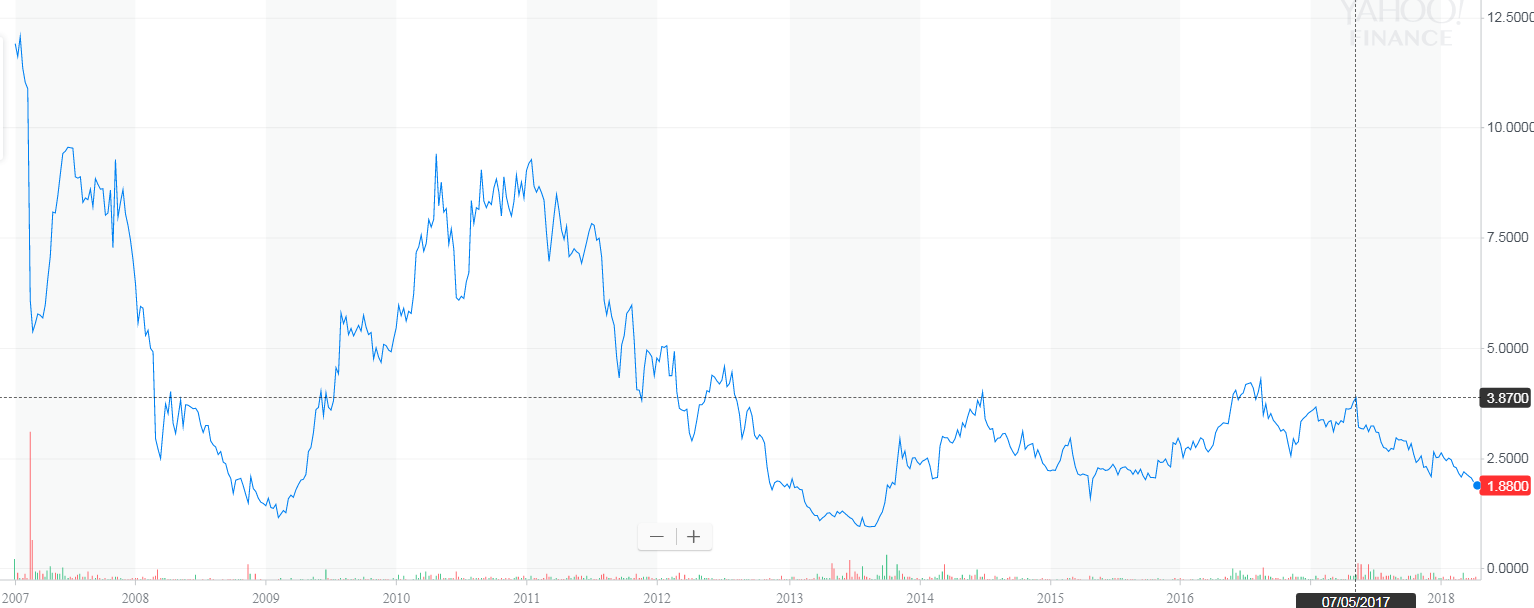
Since it went public in 2007, PRTS has consistently expanded its product offerings and sales channels, notably the launch of the private label engine line in 2008 and the acquisition of JC Whitney in 2010. However, PRTS has experienced many expansion mishaps on the way to now. As a result, sales have doubled, but profitability has lagged. The volatility is well reflected in its stock price performance, which peaked at $10 in 2011 and dropped as low as $1 in 2013.
Source: PRTS website
Since then, its operation has stabilised and its debt load reduced from $16M from $9M. PRTS has managed to improve working capital by improving debtor’s turnover in days and negotiate longer payment terms on creditors. Also, shares were repurchased at around $3. In hindsight, that was a bad capital allocation, but the management clearly believes that the company is worth at least $3.
As operations have been stabilised, since 2013, sales have increased to $300M+ from $250M, and profit and FCF have returned, yet the share price is at the same level, at around $2. The depressed price has a lot to do with the Oak Investment divestment (announced May 2017, as marked in the price chart), however, the market prices growth highly, and unfortunately, PRTS has not been able to ‘impress’ in that respect

There are legitimate reasons why PRTS’s stock is not loved and stuck at this level. Let’s explore some of the positives and negatives to see if we can uncover any value buying at this price.
II. Positives: The right channel
We have been investing in the brick and mortar retail for a while now, and we know how challenging it is to sell products offline. The change in the consumer purchasing behaviour to shop online has caused many large retailers to implode and is threatening many more. So, it appears that investing in a pure online retailer like PRTS is a hedging strategy. 91% of its revenue comesfrom online marketplaces (Amazon, eBay (NASDAQ:EBAY)) and e-commerce websites (JC Whitney, AutoParts, Carparts.com). And, out of the 91% revenue, 37% is from online marketplaces!
Unsurprisingly, the online marketplace channel is the main driver of the growth in total sales.
This looks a lot like an Amazon-esque growth strategy (but without the huge 5-year CAGR 23%), where PRTS also has to balance the trade-offs between expanding for volume or expanding for margins. Online marketplaces help volume but hurt margins as there is a selling fee involved. Moreover, PRTS mainly sells the branded products on these platforms, which carry lower margins, to begin with. The table below shows a rapidly increasing sales trend from online marketplaces, increased by 70% compared to two years ago while its websites sales decreased by 6%.
Source: 2017 10-K
A positive note may help PRTS’s go-to-market strategy is that it benefits from the growing digital trend for auto parts, which expect to continue growing (Capgemini report).
In the bigger picture, total online average order value fell by 17%, but total sales gained 16%, confirmed volume is the key driver of growth.
The remaining 9% of sales come from offline and wholesale. This segment is small therefore, we will not analyse it further.
a. Simple and expandable business model
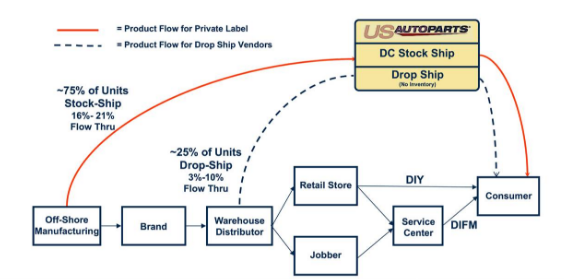
We like that PRTS’s business model is simple and has room to expand. Although there is some seasonality, the core products and services offering is simple, easy to do business and zero frills. Over the years, it has amassed over 1M SKUs and operates a smart distribution network through drop-ship-fulfilment (direct deliveries from US manufacturers’ parts – branded products) and stock-and-ship-fulfilment (delivery of private label products from distribution centres from Chesapeake, Virginia or LaSalle, Illinois).
Source: PRTS presentation
The figure shows that fewer layers and overheads are needed to sell private label products. Aside from being manufactured in Asia, this also contributed to the higher margin between 33%-36% compared to just 15%-20% in branded products.
Source: PRTS’s Presentation at the Nobel Financial Capital Markets Conference
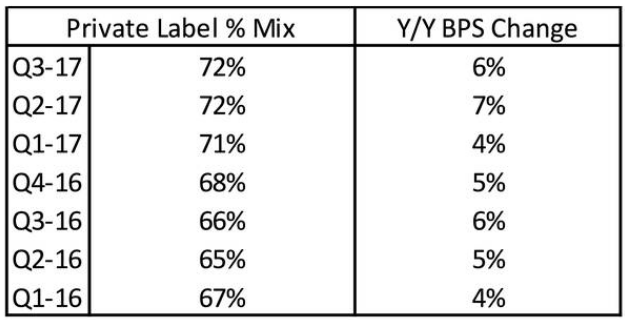
As of Q3, private label products account for 72% of the sales mix.
Source: PRTS’s Investor’s presentation
Selling online, the company can offer prices below its brick and mortar competitors (by over 40%) and 20% other online competitors (as private label products are manufactured in Asia), which are excellent for growing DIY and cost-conscious customers.
We envision a clear path to success if the expansion of the private label products is executed well.
However, there is a caveat, the increase in the private label mix is not thanks to the increase in sales of this segment, but also due to the double-digitdecrease of the branded business! The actual sales numbers of individual segments are not published (as far as we can see), so we do not know for sure if private label sales are improving at all.
Nevertheless, the management expects the growth from the private label to more than offset the decline and translate into an overall single-digit total sales growth rate.
b. Oak Investment overhang is gone
Oak Investment Partners initially owned 10.8M shares of PRTS in 2004, three years before PRTS went public. After years of negative returns, the private equity fund announced their intention to exit the investment in May 2017 when the stock price was at $4, through an ‘in-kind distributions’ of shares to its investors.
Effectively, Oak Management transferred their share ownership of PRTS to its investors. To no surprise, these investors did not want them either. Thus, since the announcement, SEC filings in May 2017, the share price has experienced a huge sales pressure. We feel this explains part of the reasons why PRTS share prices have slid from $4 to $2, despite showing improvements in FCF, earnings and operations.
c. Industry tailwinds
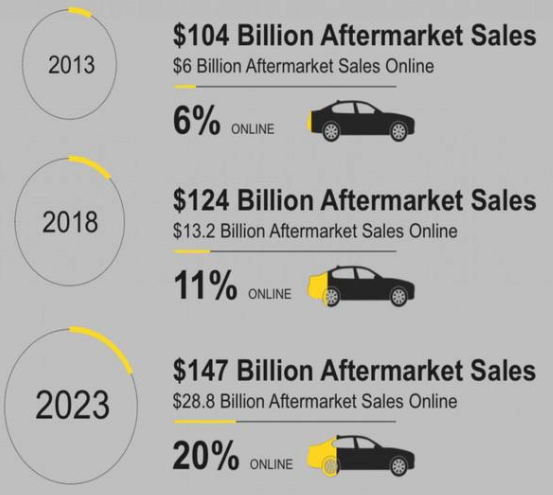
A glance at PRTS’s margins makes it look like it is operating in a cut-throat industry. Its margins are highly depressed. However, there are in fact a lot of positives working in favour for PRTS. The US aftermarket sales market is forecasted to increase to$147B by 2023, from $124B in 2018. The portion of sales coming from online is also expected to grow considerably to 20%from 11% today.
Source: US Auto Care Association
Also, as car quality has been improving over the years, the average life expectancy of cars, which is around 11 years, is expected to increase. As a result, car ownership is also expected to be extended.
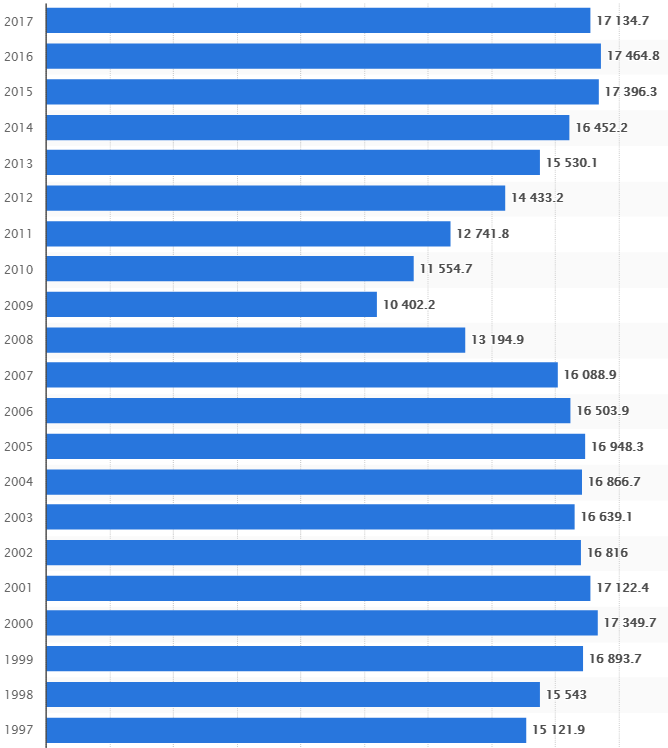
However, the number of cars on the road may not increase in the future. The fear of ‘peak auto’ sales is real. Statistica data shows that since 1977 US light vehicles sold has never surpassed the 17.5M mark. The trend is unlikely to be reversed as autonomous transport looks increasing likely.

Source: Statistica, number of cars sold in the US
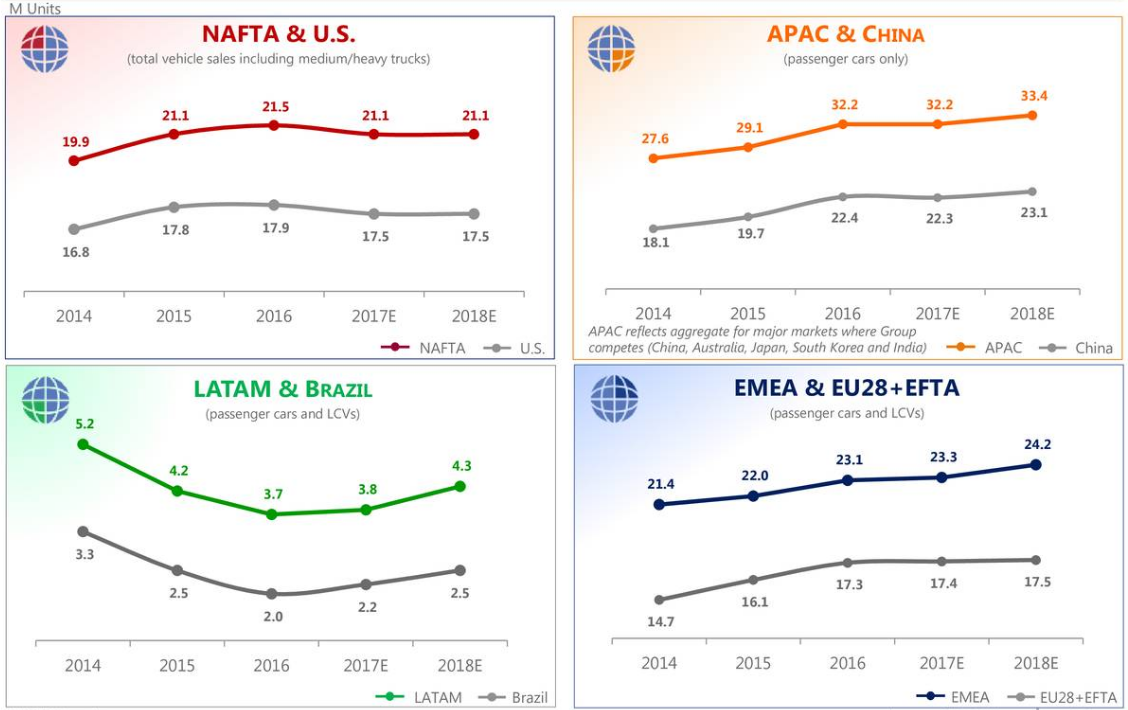
The ‘peak auto’ is more prevalent in the US as sales of new Internal Combustion Engine (ICE) cars in the US appears to be plateauing and grows much slower than other regions (China, Latin America, EMEA & EU28).

Source: Fiat Chrysler FY2016 earning slides
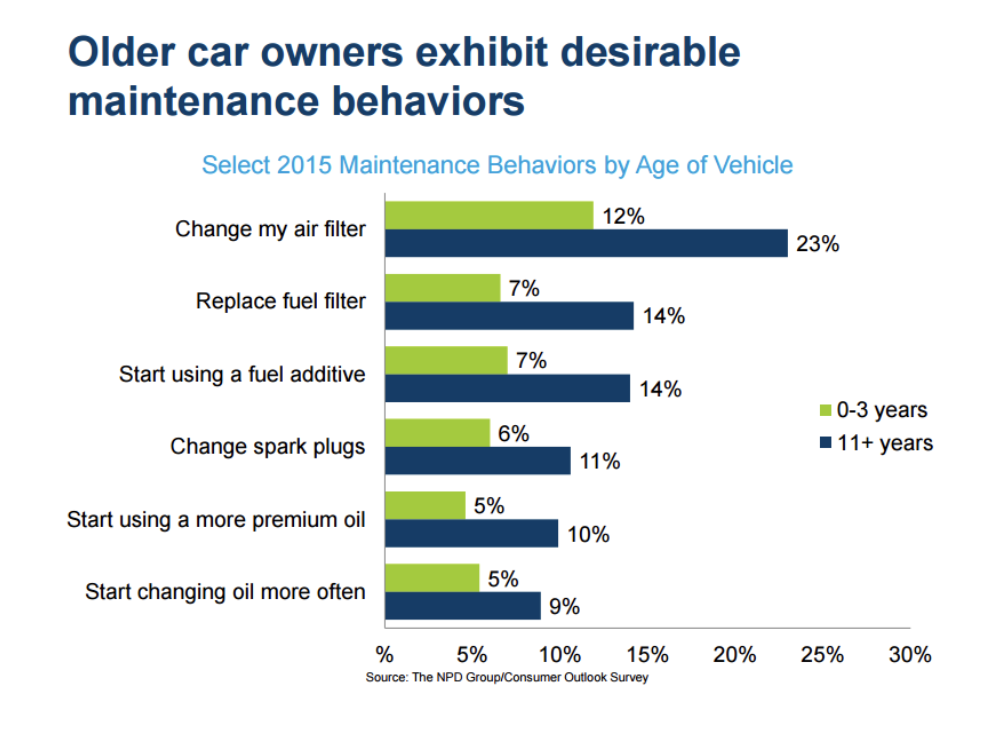
Nevertheless, we are most interested in the trend of the older cars portion of the market, and also where are the owners of these cars and how much are they likely to spend. The survey results from the NPD Group below shows some positive signs for these questions.
First, the owners of older cars (11year +) are more likely to exhibit maintenance behaviours.

Source: The NPD Group/Consumer Outlook survey
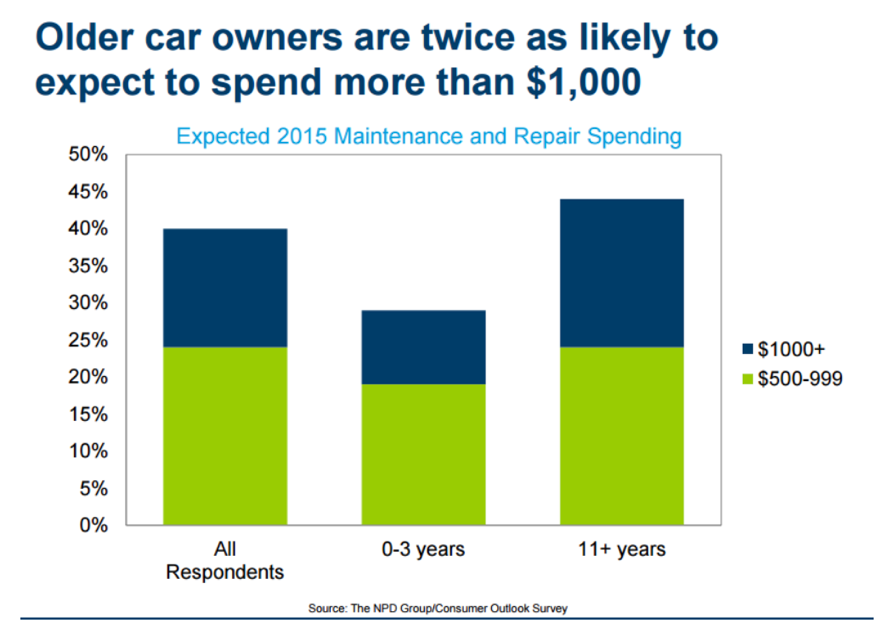
Secondly, they are also more likely to spend more than $1000.

Source: The NPD Group/Consumer Outlook survey
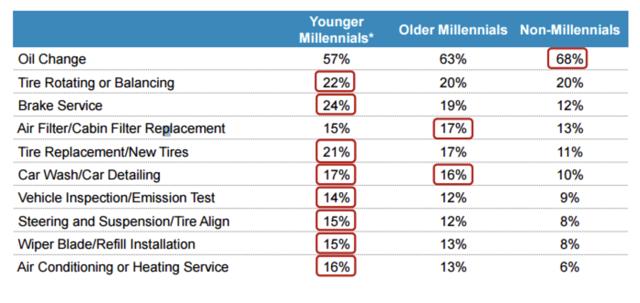
And lastly, younger millennial owners are more likely to service their cars.
Source: The NPD Group/Consumer Outlook survey
And where do these millennial go to first to decide to service their car? According to the survey, one of the first places a consumer will head to search for parts, distributors, and auto services is online. No wonder, SEO is an integral component of an integrated digital marketing strategy.
The research by Google titled “Understanding Consumers’ Local Search Behaviour” shows that 4 in 5 consumers use search engines to find information before making a purchase decision. Therefore, the higher you rank on Google, the better the results. 53% of searchers click on the first organic result, with 25% clicking on the second and third results.
By targeting millennials who own older cars, PRTS has an advantage over other brick and mortar car parts retailers.
d. Significant insider ownership
When buying in deep value or distressed opportunities, the high alignment and conviction of insiders are extremely important. We have mixed feelings with PRTS recent insider’s activity.
The latest 10-K filling does not show the exact percentage of insider ownership, but last year numbers were 43% including the Oak Investment Partners ownership of 10.8M shares. Eliminating the 30% shares it divested, insider ownership should stand around 13%. This is a meaningful amount, however, the not so good news is that there is no significant acquisition or disposal of stocks has been reported since.
Nevertheless, it seems that their compensation is tied to adjusted EBITDA, so that is a good alignment.
e. Current stock repurchase plan
The management plans to complete its $5M stock purchase, with 1.9M spent, we have $3.1M left or around 5% of the current market cap. It is a modest but meaningful addition to the margin of safety.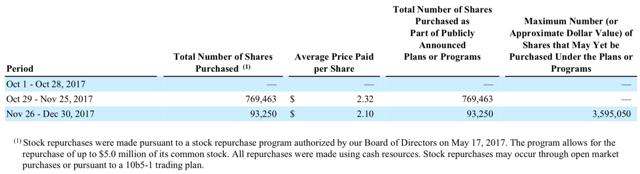
Source: PRTS Dec 2017, 10-K
However, at a turnaround stage, is it really necessary to maintain a stock repurchase program? We like bold management, and discontinuation of stock purchase programs or dividend payment to investors are good signs of conviction (see Pier 1 Imports and GNC reports we have written about recently).
III. Risks
We feel that PRTS has so much potential, but thus far, it has failed to realise. The following risks show that PRTS has a lot to do make it a ‘no-brainer’ investment.
a. Declining websites traffic
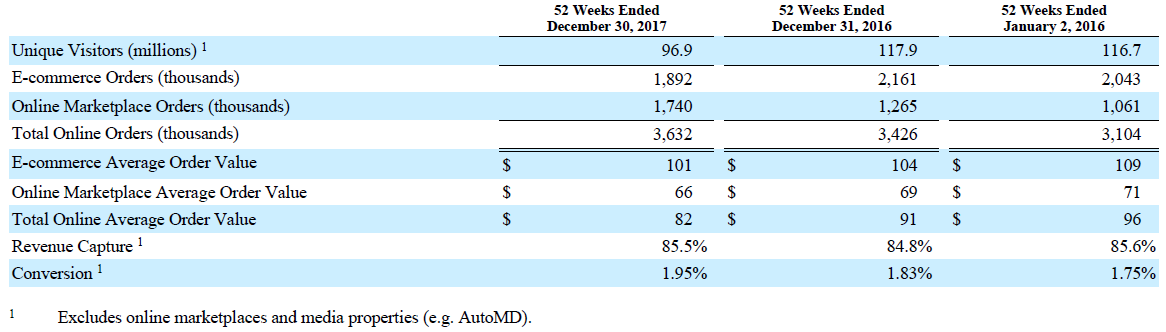
First, poor conversion! This has been a tight bottle neck to the company’s profitability. Its own websites’ conversion has not improved much for the last two years, hovering around 2% of all visitors. Worse, it doesn’t help when traffic fell to 24M last quarter from 31M in 1Q16; granted this number excludes traffic to marketplaces site, which has experienced strong growth as discussed previously. We don’t have the exact numbers, but this soothes the risk down.
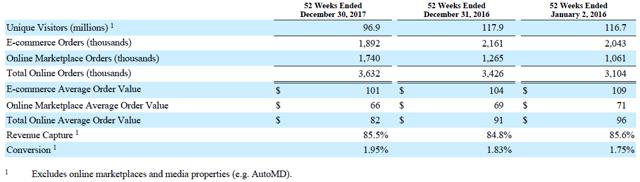
Source: 2017 10-K
As 91% of sales are generated on their websites, the primary driver of PRTS’s revenue is the ability to maximise its online presence and conversion on Google search engine. Yet, we find it difficult to comprehend why the company would spend half of its marketing expenses on printing catalogue, or $21M out of $39M marketing expenses. The marketing plan is absolutely nonsensical. We do not have the data, but if the management could cut the cost of sending out catalogue by half or by replacing that entirely with sending out cheap tablets with the database of its stock, that could reduce OPEX massively!
On top of that, they have failed to keep up with the on-going changes to the Google search engine ads methodology, thus suffered a decrease of 17.8% unique visitors compared to 2016, or 97M compared to 118M.
The other concerning factor is the number of websites that PRTS operates; they all sell the same products, so having multiple addresses online dilutes the brand of each address. It is not the same as a brick and mortar model where brand value correlates with the number of stores. Granted they have been consolidating their websites since 2013. However, as customers, we think three is a crowd.
The following table paints a decaying foothold of PRTS on the net. Traffic declines in recent quarters are quite alarming! -15% and- 18%.
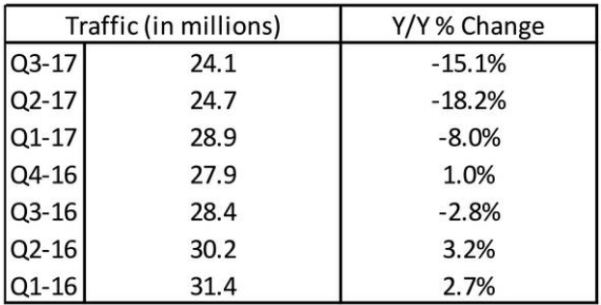
Source: PRTS’s Investor’s presentation
The descending trend is unlikely to reverse until Google search methodology is addressed. For now, the only positive is the improving conversion rate.
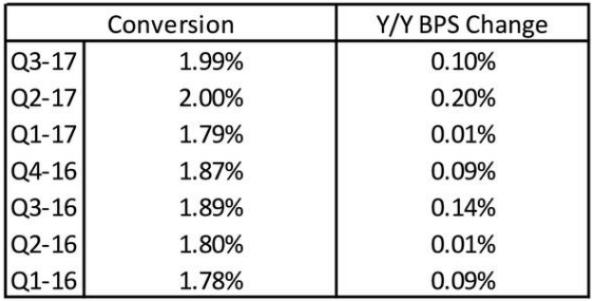
Source: PRTS’s Investor’s presentation
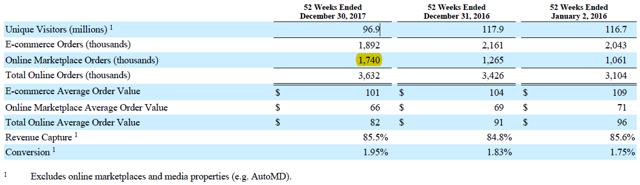
If we compare FY2017 conversion rate of 1.95% with the FY2015 conversion rate, which was at 1.68%, the improvement is quite encouraging! This shows that they are probably offering the right type of products, or they are targeting the right kind of customers, or that repeated customers are more familiar with the website. However, given the high growth rate in the online segment, they are not taking advantage of the trend. Either way, the conversion rate needs to improve considerably to offset the decline of the unique visitors shown on the first row of the table below.

Source: 2016 10-K
b. Poor margins
The loss of traffic and poor conversion trickled down to the bottom line. This is a risk in investing in PRTS as the low margins, and the lack of improvement seems to be a perpetual issue with the company.
The Q4 gross margin was at 30.3%, improved slightly thanks to higher-margin private label mix (72% of net sales, caveat mentioned previously). This is in line with the long-term range that management expects. However, the gross margin is nowhere near the 50%+ AutoZone is achieving. Granted, they enjoy a different level of economies of scale, but, since it went public, PRTS gross margin has deteriorated from 34.3% in 2008. The previous seven quarters show a slowly deteriorating gross margin.
Source: PRTS’s Investor’s presentation
Going forward, the only real area that PRTS can change is either streamlining their OPEX or increasing sales volume to improve the net profit. As mentioned, marketing spending is nonsensical, however, taking almost of 50% of the overall OPEX, if they manage to fix this inefficiency, the net margin will be improved considerably.
One thing that the management did mention is that, as they see more sales from the marketplaces, costs from the call centres and marketing will likely to fall. As Q4 results demonstrated, sales from marketplaces soared, and OpEx fell to 29.4% from 29.9% in the previous year. In number terms, they saved $2M compared to last year. Thus, pushing for higher volume in marketplaces sales may be accretive to margins going forward.
This is rather good news, as expanding sales on online marketplaces or expanding sales in its website (private labels) likely to lead to higher net margins! Investors are unlikely to notice this.
Higher costs of sales and fulfilment costs
The third risk is the rising fuel prices which will negatively impact both cost of sales (includes inbound shipping) and fulfilment costs ( includes outbound trucks transportation). Unfortunately, higher fuel prices will be most likely passed on to PRTS from its partners, but PRTS will a have a hard time to pass it on to the customer.
PRTS sources its 55K SKU private label products from Taiwan and China via cargo ships. Oil prices are expected to be between $60-$70/b in 2018, significantly higher than the average of 2016 and 2017. Fulfilment cost is 25% of gross profit; higher fuel prices are likely to materially impact PRTS margins.
Higher fuel prices will also limit the growth of miles driven and put added pressure on lower-income consumers. Thus most will likely be DIYers that PRTS targets.
Gross margin has been recovering as of late, but higher fuel prices may pressure both revenue and costs. We will continue to watch the effect closely.

Source: Chart generated using Stockrow chart tools
Higher tariffs and steel price
Similarly, higher tariffs and higher steel price will also negatively impact PRTS margins. As China’s policy to clean up its pollution, 30% reduction in steel production is likely to be in full implementation in 2018; prices will be at a record high for many years to come. Again, it’s unlikely PRTS can pass all of the higher cost down to the consumer.
Despite, the management said that they have:
Dollar weakening
Adding more salt to the wound is that dropping purchasing power of the dollar. PRTS uses dollars to buy all of its private labels overseas. Also, more than 70 percent of its company’s employees is in the Philippines (established since April 2017). So as long as the dollar is low, its wage costs and cost of sales will likely increase.
Misaligned compensation
Source: 2017 10-K
Lastly, we believe that the management should be properly incentivised. However, we also believe that it should be aligned with shareholders' interest. The company’s management was grossly overpaid in the period between 4Q16 and 1Q17. They achieved an EBITDA increase of 1.5x, but their stock compensation saw an increase of 1.75x. This is certainly out of line if we look at the delta between 4Q15 and 1Q16, EBITDA improved 2x, and management was rewarded accordingly but certainly not 1.75x like in the recent period.
You can argue that is trivial, but the management is well aware of the challenges of the auto industry, thus overpaying themselves in this grim period is not responsible.
IV. Favourable fundamentals and valuations
We have exposed more negatives than positives above. Thus, current investors would be pleased to know that fundamentally, PRTS is healthy financially and is trading cheaply.
The company reports $10M debts, $2.85M cash, undrawn $30M credit facility, small operating and capital leases obligations in the short term.

Source: 2017 10-K
Management is expecting minimal CAPEX going forward, in the range around $5M to $5.5M for 2018. Adjusted EBITDA is also expected to be between $14.5M to $16M; a slight increase from $14.2M in 2017.
Also, 2018 will be the third consecutive year of positive FCF, between $7M to $9M. As a result, with the market cap of $67M ($1.92/share), the company is trading at just 4.6x FY2018 EBITDA and 8.3x FY2018 FCF.
We consider this very cheap for pure-online specialty retail, especially with minimal CAPEX and opportunities to cut further costs going forward. Hypothetically, if the $21M catalogue costs could be halved or slashed, forward EBITDA and FCF could double.
Industry Peers
PRTS competes with both online and offline retailers. Thus, there is a wide range of competitors, but the major ones are AutoZone, Napa Auto Parts, Advance Auto Parts (NYSE:AAP), CarQuest, O’Reilly Automotive (NASDAQ:ORLY) and Pep Boys. Large online marketplaces such as Amazon.com and sellers on eBay or your local auto repair shops are also considered competitors.
Sources: Morningstar, data as of 20th April 2018.
Arguably, most peers are trading cheaply compared to its historical valuation. With PRTS, whichever angle you look at, the valuation metrics above show that the company currently trades at a significant bargain compared to its peers and the previous 5-year average.
Take away
There seem to be two detached narratives for PRTS stock price and its underlying business. The stock has had a volatile period since 2016, and as it has been on a perpetual decline. The lack of growth has been the story, but still, the fall was accelerated when Oak Investment announced the divestment of PRTS’s shares to investors.
Nevertheless, when in doubt, returning to fundamentals and valuation demonstrate that PRTS is a compelling investment at under $2! Interestingly, it is also a better company than when it was trading at $4. However, the management has done a poor job with marketing, so we will be watching closely what they have planned.
We feel that when the selling pressure of Oak Investment’s ‘in-kind distributions’ is gone and that the marketing spending is streamlined, the market sentiment about the company will change.
Lastly, when evaluating PRTS, we feel the company is an attractive acquisition target. We found that the cost and revenue synergies make a lot of sense. PRTS can be a lot more valuable under the right management. We will publish part II shortly.
Author's note: If you enjoyed our article, follow us to receive part II and latest investment opportunities. Lastly, please do additional due diligence and enjoy investing.
Disclosure: I am/we are long PRTS.
I wrote this article myself, and it expresses my own opinions. I am not receiving compensation for it (other than from Seeking Alpha). I have no business relationship with any company whose stock is mentioned in this article.
Like this article
Apr. 30, 2018 2:19 PM ET |
About: U.S. Auto Parts Network, Inc. (PRTS), Includes: AAP, AZO, ORLY
DTF Capital
Long only, value, small-cap, mid-cap
(370 followers)
Summary
Improving outlook coming from better product sales mix.
High OPEX can be slashed, management has done a poor job in marketing, however, it is fixable.
Shares' selling pressure is overdone as its largest investor's divestment looks completed.
Risks in website's traffic decline and low conversion are not as bad as it seems.
A compelling investment in the aftersales auto industry.
This is a two-part analysis of U.S. Auto Parts Network Inc. (PRTS). Part I lays out the background and fundamental analysis and Part II lays out a more speculative scenario where PRTS is proposed as a potential acquisition target.
Investment Thesis
U.S. Auto Parts Network, Inc., "PRTS" is a pure online retailer of three types of auto parts, collision, engines and performance.
Quick financial facts (as of April 27, 2018):
Share price: $1.92
Market cap: $67M
Number of common stock outstanding: 34.8M (10-K, March 9, 2018)
The company was founded in 1995, and since it went public in 2007, the company’s sales have doubled, but profitability remains low, at 1.5% of sales. Its marketing execution has been poor as it spent double the amount of the industry average yet its website traffic, and conversions have been unimpressive. The auto industry and the ‘Do-It-Yourself’ auto repair segment, in particular, has been “peaking” which has put further strain on US Auto Parts Network’s effort to move forward.
As a result, around the middle of 2017, its biggest and one of its earliest investors while the company was private in 2004, Oak Investment announced it would distribute all of its 28% stake to its limited partners. Investors got spooked, and PRTS’s stock price slid from $4, or $140M market cap to $1.92, or $67M market cap (as of 27th April 2018).
We believe the sales pressure should be finished as its outlook has continued to improve and it’s likely that most of the limited partners have divested the shares. We outline three reasons why PRTS is a good investment.
First, on the fundamental aspect, there are many things to like. The company has only generated FCF three times in the last ten years; two of those were in previous two years. FCF will continue in the future and has a high chance of improving as we expect the higher margin private label products will expand. In fact, we expect that FCF can be doubled as CAPEX will be minimal and its hefty marketing cost can be slashed in half fairly easily.
Secondly, before the sales of Oak Investment’s stake, the market was valuing the company between $3-$4/share, a $100M-$140M market cap. Fundamentally, nothing has changed since. The fact that we see ways that the company's bottom line can improve makes the current share price more puzzling. Thus, the opportunity to invest becomes more evident as the market continues to be cautious even as the selling pressure fizzles out.
Lastly, given the consolidation in the aftersales market by Icahn’s empire and Amazon’s (NASDAQ:AMZN) Car parts reach, PRTS could also be an accretive acquisition for companies with a large presence in brick and mortar but lacks the online footprint that PRTS commands. Part II of the analysis will expand on this.
The fact is PRTS is almost debt-free, generates FCF and has growth opportunities (fixable problems); it doesn’t need to perform fantastically to deserve a higher valuation. Nevertheless, investors will need to be incredibly patient and risk seeking to see PRTS’s stock price to appreciate to $4. This is a 100% upside opportunity.
Before we dive into the details, it would be wrong not to mention that investing in PRTS might not be a good idea.
First, PRTS’s credential to improve its operation is poor. Its net margin has not surpassed 2.4% since it went public and is currently at 1.5%, and despite favourable industry trajectory, its websites’ traffic has declined. We have reason to believe this risk is actually not as bad as it looks, which we will explain later in the analysis.
Secondly, a quick comparison with the auto parts industry leader, AutoZone (AZO), makes PRTS look incredibly bad. Over the last 10 years, like PRTS, AutoZone also doubled its sales, but has grown more efficiently and profitably, currently operating at 50%+ gross margin, 17%+ net margin and 10% FCF margin, compared to 29%, 1.5% and 2% respectively at PRTS!
So why should you consider PRTS? Let’s dig in!
Detailed Analysis
The following sections will be a deep dive into the positives and negatives of investing in PRTS. That will be followed by our fundamentals review of the company, and lastly, we will demonstrate why PRTS should be an attractive acquisition target.
I. Company background
Founded in 1995, US Auto Parts Network is an online aftermarket auto-parts retailer of cheap and easy-to-upgrade auto parts and accessories. To date, the company amassed huge stock keeping units (SKUs) to over 1M parts, subdivided into three categories: collision, engine and performance.
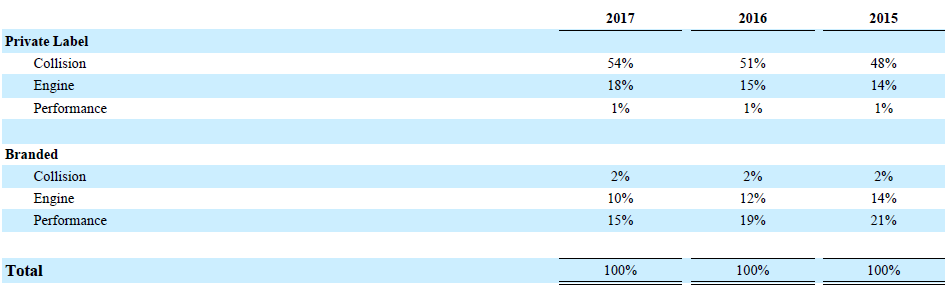
Source: PRTS 10K, 2017, sales mix
Of the 1M SKUs, 55k SKUs are private label; they have a higher gross margin (33%-36%), as they are sourced from Asia and are cheaper to make. The remaining SKUs are branded products, which carry lower margin (15%-20%) and are sourced from the US.
Source: PRTS’s Presentation at the Nobel Financial Capital Markets Conference
The online platform allows it to offer double the amount of some of its direct competitors, for example, Parts Authority (500K SKUs), and even higher than the industry leader, AutoZone (750k SKUs).
Since it went public in 2007, PRTS has consistently expanded its product offerings and sales channels, notably the launch of the private label engine line in 2008 and the acquisition of JC Whitney in 2010. However, PRTS has experienced many expansion mishaps on the way to now. As a result, sales have doubled, but profitability has lagged. The volatility is well reflected in its stock price performance, which peaked at $10 in 2011 and dropped as low as $1 in 2013.

Source: PRTS website
Since then, its operation has stabilised and its debt load reduced from $16M from $9M. PRTS has managed to improve working capital by improving debtor’s turnover in days and negotiate longer payment terms on creditors. Also, shares were repurchased at around $3. In hindsight, that was a bad capital allocation, but the management clearly believes that the company is worth at least $3.
As operations have been stabilised, since 2013, sales have increased to $300M+ from $250M, and profit and FCF have returned, yet the share price is at the same level, at around $2. The depressed price has a lot to do with the Oak Investment divestment (announced May 2017, as marked in the price chart), however, the market prices growth highly, and unfortunately, PRTS has not been able to ‘impress’ in that respect
There are legitimate reasons why PRTS’s stock is not loved and stuck at this level. Let’s explore some of the positives and negatives to see if we can uncover any value buying at this price.
II. Positives: The right channel
We have been investing in the brick and mortar retail for a while now, and we know how challenging it is to sell products offline. The change in the consumer purchasing behaviour to shop online has caused many large retailers to implode and is threatening many more. So, it appears that investing in a pure online retailer like PRTS is a hedging strategy. 91% of its revenue comesfrom online marketplaces (Amazon, eBay (NASDAQ:EBAY)) and e-commerce websites (JC Whitney, AutoParts, Carparts.com). And, out of the 91% revenue, 37% is from online marketplaces!
Unsurprisingly, the online marketplace channel is the main driver of the growth in total sales.
This looks a lot like an Amazon-esque growth strategy (but without the huge 5-year CAGR 23%), where PRTS also has to balance the trade-offs between expanding for volume or expanding for margins. Online marketplaces help volume but hurt margins as there is a selling fee involved. Moreover, PRTS mainly sells the branded products on these platforms, which carry lower margins, to begin with. The table below shows a rapidly increasing sales trend from online marketplaces, increased by 70% compared to two years ago while its websites sales decreased by 6%.

Source: 2017 10-K
A positive note may help PRTS’s go-to-market strategy is that it benefits from the growing digital trend for auto parts, which expect to continue growing (Capgemini report).
In the bigger picture, total online average order value fell by 17%, but total sales gained 16%, confirmed volume is the key driver of growth.
The remaining 9% of sales come from offline and wholesale. This segment is small therefore, we will not analyse it further.
a. Simple and expandable business model
We like that PRTS’s business model is simple and has room to expand. Although there is some seasonality, the core products and services offering is simple, easy to do business and zero frills. Over the years, it has amassed over 1M SKUs and operates a smart distribution network through drop-ship-fulfilment (direct deliveries from US manufacturers’ parts – branded products) and stock-and-ship-fulfilment (delivery of private label products from distribution centres from Chesapeake, Virginia or LaSalle, Illinois).
Source: PRTS presentation
The figure shows that fewer layers and overheads are needed to sell private label products. Aside from being manufactured in Asia, this also contributed to the higher margin between 33%-36% compared to just 15%-20% in branded products.
Source: PRTS’s Presentation at the Nobel Financial Capital Markets Conference
As of Q3, private label products account for 72% of the sales mix.
Source: PRTS’s Investor’s presentation
Selling online, the company can offer prices below its brick and mortar competitors (by over 40%) and 20% other online competitors (as private label products are manufactured in Asia), which are excellent for growing DIY and cost-conscious customers.
We envision a clear path to success if the expansion of the private label products is executed well.
However, there is a caveat, the increase in the private label mix is not thanks to the increase in sales of this segment, but also due to the double-digitdecrease of the branded business! The actual sales numbers of individual segments are not published (as far as we can see), so we do not know for sure if private label sales are improving at all.
Nevertheless, the management expects the growth from the private label to more than offset the decline and translate into an overall single-digit total sales growth rate.
b. Oak Investment overhang is gone
Oak Investment Partners initially owned 10.8M shares of PRTS in 2004, three years before PRTS went public. After years of negative returns, the private equity fund announced their intention to exit the investment in May 2017 when the stock price was at $4, through an ‘in-kind distributions’ of shares to its investors.
Effectively, Oak Management transferred their share ownership of PRTS to its investors. To no surprise, these investors did not want them either. Thus, since the announcement, SEC filings in May 2017, the share price has experienced a huge sales pressure. We feel this explains part of the reasons why PRTS share prices have slid from $4 to $2, despite showing improvements in FCF, earnings and operations.
c. Industry tailwinds
A glance at PRTS’s margins makes it look like it is operating in a cut-throat industry. Its margins are highly depressed. However, there are in fact a lot of positives working in favour for PRTS. The US aftermarket sales market is forecasted to increase to$147B by 2023, from $124B in 2018. The portion of sales coming from online is also expected to grow considerably to 20%from 11% today.
Source: US Auto Care Association
Also, as car quality has been improving over the years, the average life expectancy of cars, which is around 11 years, is expected to increase. As a result, car ownership is also expected to be extended.
However, the number of cars on the road may not increase in the future. The fear of ‘peak auto’ sales is real. Statistica data shows that since 1977 US light vehicles sold has never surpassed the 17.5M mark. The trend is unlikely to be reversed as autonomous transport looks increasing likely.
Source: Statistica, number of cars sold in the US
The ‘peak auto’ is more prevalent in the US as sales of new Internal Combustion Engine (ICE) cars in the US appears to be plateauing and grows much slower than other regions (China, Latin America, EMEA & EU28).
Source: Fiat Chrysler FY2016 earning slides
Nevertheless, we are most interested in the trend of the older cars portion of the market, and also where are the owners of these cars and how much are they likely to spend. The survey results from the NPD Group below shows some positive signs for these questions.
First, the owners of older cars (11year +) are more likely to exhibit maintenance behaviours.
Source: The NPD Group/Consumer Outlook survey
Secondly, they are also more likely to spend more than $1000.
Source: The NPD Group/Consumer Outlook survey
And lastly, younger millennial owners are more likely to service their cars.

Source: The NPD Group/Consumer Outlook survey
And where do these millennial go to first to decide to service their car? According to the survey, one of the first places a consumer will head to search for parts, distributors, and auto services is online. No wonder, SEO is an integral component of an integrated digital marketing strategy.
The research by Google titled “Understanding Consumers’ Local Search Behaviour” shows that 4 in 5 consumers use search engines to find information before making a purchase decision. Therefore, the higher you rank on Google, the better the results. 53% of searchers click on the first organic result, with 25% clicking on the second and third results.
By targeting millennials who own older cars, PRTS has an advantage over other brick and mortar car parts retailers.
d. Significant insider ownership
When buying in deep value or distressed opportunities, the high alignment and conviction of insiders are extremely important. We have mixed feelings with PRTS recent insider’s activity.
The latest 10-K filling does not show the exact percentage of insider ownership, but last year numbers were 43% including the Oak Investment Partners ownership of 10.8M shares. Eliminating the 30% shares it divested, insider ownership should stand around 13%. This is a meaningful amount, however, the not so good news is that there is no significant acquisition or disposal of stocks has been reported since.
Nevertheless, it seems that their compensation is tied to adjusted EBITDA, so that is a good alignment.
e. Current stock repurchase plan
The management plans to complete its $5M stock purchase, with 1.9M spent, we have $3.1M left or around 5% of the current market cap. It is a modest but meaningful addition to the margin of safety.
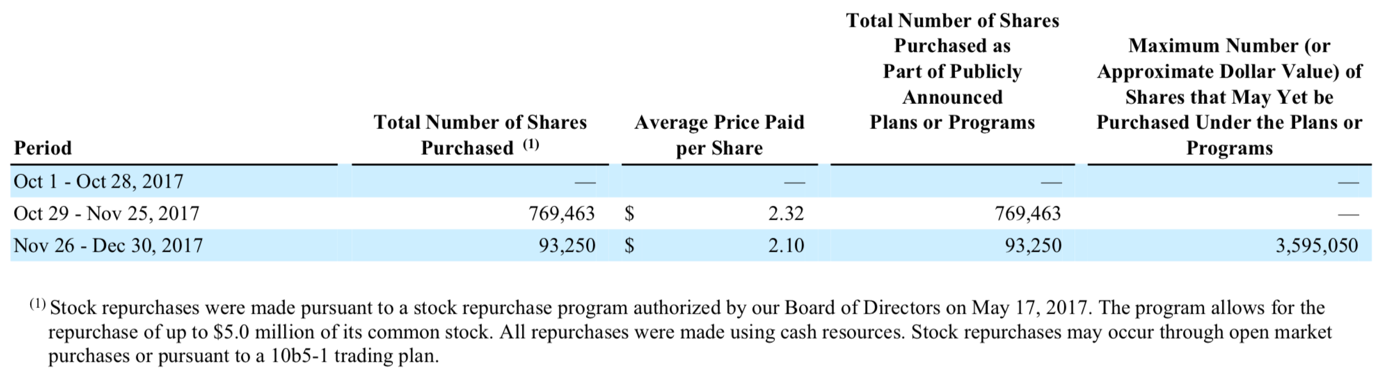
Source: PRTS Dec 2017, 10-K
However, at a turnaround stage, is it really necessary to maintain a stock repurchase program? We like bold management, and discontinuation of stock purchase programs or dividend payment to investors are good signs of conviction (see Pier 1 Imports and GNC reports we have written about recently).
III. Risks
We feel that PRTS has so much potential, but thus far, it has failed to realise. The following risks show that PRTS has a lot to do make it a ‘no-brainer’ investment.
a. Declining websites traffic
First, poor conversion! This has been a tight bottle neck to the company’s profitability. Its own websites’ conversion has not improved much for the last two years, hovering around 2% of all visitors. Worse, it doesn’t help when traffic fell to 24M last quarter from 31M in 1Q16; granted this number excludes traffic to marketplaces site, which has experienced strong growth as discussed previously. We don’t have the exact numbers, but this soothes the risk down.
Source: 2017 10-K
As 91% of sales are generated on their websites, the primary driver of PRTS’s revenue is the ability to maximise its online presence and conversion on Google search engine. Yet, we find it difficult to comprehend why the company would spend half of its marketing expenses on printing catalogue, or $21M out of $39M marketing expenses. The marketing plan is absolutely nonsensical. We do not have the data, but if the management could cut the cost of sending out catalogue by half or by replacing that entirely with sending out cheap tablets with the database of its stock, that could reduce OPEX massively!
On top of that, they have failed to keep up with the on-going changes to the Google search engine ads methodology, thus suffered a decrease of 17.8% unique visitors compared to 2016, or 97M compared to 118M.
The other concerning factor is the number of websites that PRTS operates; they all sell the same products, so having multiple addresses online dilutes the brand of each address. It is not the same as a brick and mortar model where brand value correlates with the number of stores. Granted they have been consolidating their websites since 2013. However, as customers, we think three is a crowd.
The following table paints a decaying foothold of PRTS on the net. Traffic declines in recent quarters are quite alarming! -15% and- 18%.
Source: PRTS’s Investor’s presentation
The descending trend is unlikely to reverse until Google search methodology is addressed. For now, the only positive is the improving conversion rate.
Source: PRTS’s Investor’s presentation
If we compare FY2017 conversion rate of 1.95% with the FY2015 conversion rate, which was at 1.68%, the improvement is quite encouraging! This shows that they are probably offering the right type of products, or they are targeting the right kind of customers, or that repeated customers are more familiar with the website. However, given the high growth rate in the online segment, they are not taking advantage of the trend. Either way, the conversion rate needs to improve considerably to offset the decline of the unique visitors shown on the first row of the table below.

Source: 2016 10-K
b. Poor margins
The loss of traffic and poor conversion trickled down to the bottom line. This is a risk in investing in PRTS as the low margins, and the lack of improvement seems to be a perpetual issue with the company.
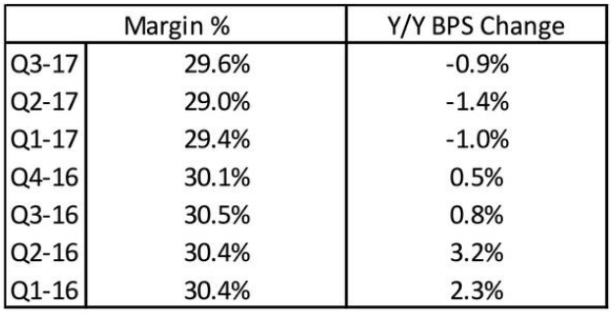
The Q4 gross margin was at 30.3%, improved slightly thanks to higher-margin private label mix (72% of net sales, caveat mentioned previously). This is in line with the long-term range that management expects. However, the gross margin is nowhere near the 50%+ AutoZone is achieving. Granted, they enjoy a different level of economies of scale, but, since it went public, PRTS gross margin has deteriorated from 34.3% in 2008. The previous seven quarters show a slowly deteriorating gross margin.
Source: PRTS’s Investor’s presentation
Going forward, the only real area that PRTS can change is either streamlining their OPEX or increasing sales volume to improve the net profit. As mentioned, marketing spending is nonsensical, however, taking almost of 50% of the overall OPEX, if they manage to fix this inefficiency, the net margin will be improved considerably.
One thing that the management did mention is that, as they see more sales from the marketplaces, costs from the call centres and marketing will likely to fall. As Q4 results demonstrated, sales from marketplaces soared, and OpEx fell to 29.4% from 29.9% in the previous year. In number terms, they saved $2M compared to last year. Thus, pushing for higher volume in marketplaces sales may be accretive to margins going forward.
This is rather good news, as expanding sales on online marketplaces or expanding sales in its website (private labels) likely to lead to higher net margins! Investors are unlikely to notice this.
Higher costs of sales and fulfilment costs
The third risk is the rising fuel prices which will negatively impact both cost of sales (includes inbound shipping) and fulfilment costs ( includes outbound trucks transportation). Unfortunately, higher fuel prices will be most likely passed on to PRTS from its partners, but PRTS will a have a hard time to pass it on to the customer.
PRTS sources its 55K SKU private label products from Taiwan and China via cargo ships. Oil prices are expected to be between $60-$70/b in 2018, significantly higher than the average of 2016 and 2017. Fulfilment cost is 25% of gross profit; higher fuel prices are likely to materially impact PRTS margins.
Higher fuel prices will also limit the growth of miles driven and put added pressure on lower-income consumers. Thus most will likely be DIYers that PRTS targets.
Gross margin has been recovering as of late, but higher fuel prices may pressure both revenue and costs. We will continue to watch the effect closely.
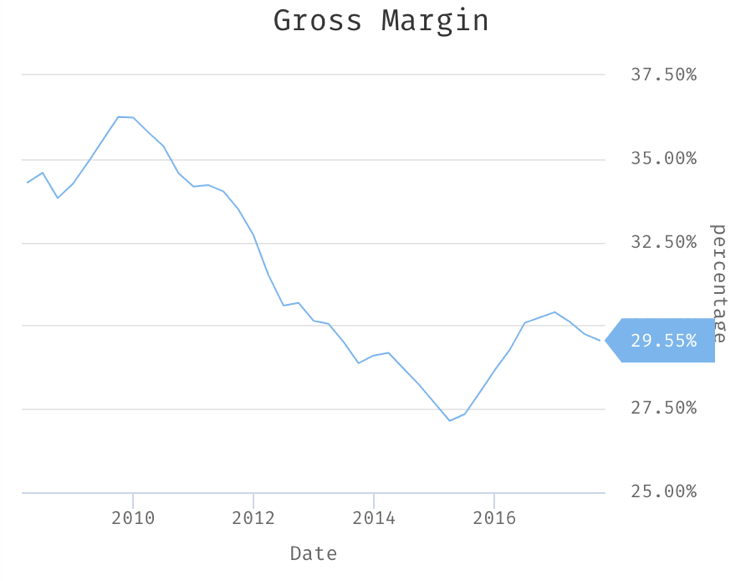
Source: Chart generated using Stockrow chart tools
Higher tariffs and steel price
Similarly, higher tariffs and higher steel price will also negatively impact PRTS margins. As China’s policy to clean up its pollution, 30% reduction in steel production is likely to be in full implementation in 2018; prices will be at a record high for many years to come. Again, it’s unlikely PRTS can pass all of the higher cost down to the consumer.
Despite, the management said that they have:
“…renegotiated terms with one of [their] shipping suppliers that will enable [the company] to be more competitive and reinforces [their] ongoing efforts to manage expenses and better align [their] cost structure.”
4Q17 Earnings Call
Dollar weakening
Adding more salt to the wound is that dropping purchasing power of the dollar. PRTS uses dollars to buy all of its private labels overseas. Also, more than 70 percent of its company’s employees is in the Philippines (established since April 2017). So as long as the dollar is low, its wage costs and cost of sales will likely increase.
Misaligned compensation

Source: 2017 10-K
Lastly, we believe that the management should be properly incentivised. However, we also believe that it should be aligned with shareholders' interest. The company’s management was grossly overpaid in the period between 4Q16 and 1Q17. They achieved an EBITDA increase of 1.5x, but their stock compensation saw an increase of 1.75x. This is certainly out of line if we look at the delta between 4Q15 and 1Q16, EBITDA improved 2x, and management was rewarded accordingly but certainly not 1.75x like in the recent period.
You can argue that is trivial, but the management is well aware of the challenges of the auto industry, thus overpaying themselves in this grim period is not responsible.
IV. Favourable fundamentals and valuations
We have exposed more negatives than positives above. Thus, current investors would be pleased to know that fundamentally, PRTS is healthy financially and is trading cheaply.
The company reports $10M debts, $2.85M cash, undrawn $30M credit facility, small operating and capital leases obligations in the short term.
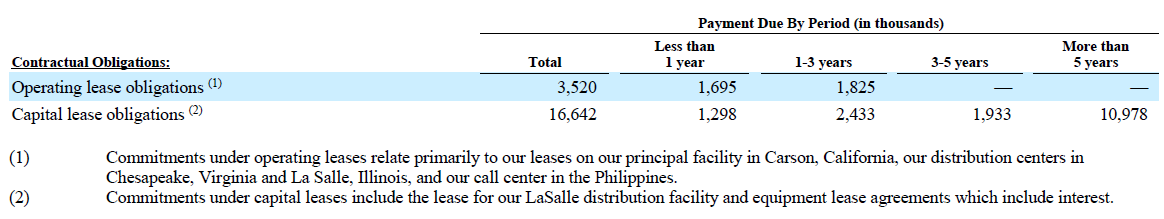
Source: 2017 10-K
Management is expecting minimal CAPEX going forward, in the range around $5M to $5.5M for 2018. Adjusted EBITDA is also expected to be between $14.5M to $16M; a slight increase from $14.2M in 2017.
Also, 2018 will be the third consecutive year of positive FCF, between $7M to $9M. As a result, with the market cap of $67M ($1.92/share), the company is trading at just 4.6x FY2018 EBITDA and 8.3x FY2018 FCF.
We consider this very cheap for pure-online specialty retail, especially with minimal CAPEX and opportunities to cut further costs going forward. Hypothetically, if the $21M catalogue costs could be halved or slashed, forward EBITDA and FCF could double.
Industry Peers
PRTS competes with both online and offline retailers. Thus, there is a wide range of competitors, but the major ones are AutoZone, Napa Auto Parts, Advance Auto Parts (NYSE:AAP), CarQuest, O’Reilly Automotive (NASDAQ:ORLY) and Pep Boys. Large online marketplaces such as Amazon.com and sellers on eBay or your local auto repair shops are also considered competitors.
| Ticker | P/S | P/E | P/CF | P/CF 5Y Ave |
| PRTS | 0.3 | 3.1 | 6.6 | 12.8 |
| AZO | 1.7 | 13.9 | 10.5 | 14.7 |
| AAP | 0.9 | 17.4 | 13.8 | 17.6 |
| ORLY | 2.4 | 18.7 | 15.1 | 17.5 |
| Industry | 3.2 | 70.1 | 9.3 | - |
| S&P 500 | 2.2 | 21.8 | 14 | - |
Sources: Morningstar, data as of 20th April 2018.
Arguably, most peers are trading cheaply compared to its historical valuation. With PRTS, whichever angle you look at, the valuation metrics above show that the company currently trades at a significant bargain compared to its peers and the previous 5-year average.
Take away
There seem to be two detached narratives for PRTS stock price and its underlying business. The stock has had a volatile period since 2016, and as it has been on a perpetual decline. The lack of growth has been the story, but still, the fall was accelerated when Oak Investment announced the divestment of PRTS’s shares to investors.
Nevertheless, when in doubt, returning to fundamentals and valuation demonstrate that PRTS is a compelling investment at under $2! Interestingly, it is also a better company than when it was trading at $4. However, the management has done a poor job with marketing, so we will be watching closely what they have planned.
“… [in Q4] we did deploy a mobile app on carparts.com. We've seen some material improvements in terms of conversion across the mobile experience. We will deploy that across other sites. “
- Q4 Earnings Call
We feel that when the selling pressure of Oak Investment’s ‘in-kind distributions’ is gone and that the marketing spending is streamlined, the market sentiment about the company will change.
Lastly, when evaluating PRTS, we feel the company is an attractive acquisition target. We found that the cost and revenue synergies make a lot of sense. PRTS can be a lot more valuable under the right management. We will publish part II shortly.
Author's note: If you enjoyed our article, follow us to receive part II and latest investment opportunities. Lastly, please do additional due diligence and enjoy investing.
Disclosure: I am/we are long PRTS.
I wrote this article myself, and it expresses my own opinions. I am not receiving compensation for it (other than from Seeking Alpha). I have no business relationship with any company whose stock is mentioned in this article.
Like this article
[FONT=wf_segoe-ui_normal]US Auto Parts Network - Potential Acquisition Target
[/FONT]May. 1.18 | About: U.S. Auto (PRTS)
DTF Capital
Summary
This is the second part of US Auto Parts Network analysis.
Recent M&A activities hot up in the aftersales market.
US Auto Parts Network provides an established online channel for pure bricks-and-mortar competitors.
The company trading at a fantastically cheap price for a buy-out.
Although with operation inefficiencies, in better hands, this could be a great acquisition target.
This is the second part of the analysis of US Auto Parts Network Inc. (PRTS), it lays out a more speculative scenario where PRTS is proposed as a potential acquisition target. Please, read Part I for the background and fundamental analysis of the company.
PRTS as a potential acquisition target
Evaluating PRTS and the industry revealed to us that the company is, in fact, a great acquisition candidate. The main reasons are thanks to the highly active M&A activities in recent years, especially from a particular billionaire - Carl Icahn, and what PRTS can bring to the table. However, we need to remind investors that the opportunity that PRTS can be sold for a premium is purely speculative.
Recent M&A activities
As we have alluded to you in the first part of the analysis that even though new cars are coming in slower to the market, we must not forget that older cars are on the road for longer, and these owners are also spending more than ever to maximize the lifetime value of their vehicles. This rising demand for aftermarket parts and services is spurring new growth and revenue opportunities for a wide range of businesses operating in the automotive aftermarket industry.
The last few years saw many M&A activities. Most recently, Parts Authority, the US automotive and truck parts company agreed to acquire Interamerican Motor Corporation, a leader in European and Asian branded replacement parts, from AutoZone (NYSE:AZO) in February 2018. The deal allows Parts Authority to expand product offerings, customer touch points and geographies.
Elsewhere, Uni-Select and GPC also made acquisitions to bolster their product line and geography.
Then we also have one of PRTS’ competitors - Pep Boys (NYSE:PBY), which was almost bought out by Bridgestone in 2015, until Carl Icahn stepped in and outbid the Japanese tire company three times to acquire the company at the eventual price of $1.03B.
Arguably some of these acquisitions were hugely overvalued but those who have read about Carl Icahn, know that he is on a mission to build an automotive ecosystem that will counteract a dying culture of owning personal cars, opting instead for communal rideshares or short-term rentals.
He wants to sell cars to Uber and Lyft, then hires fleet operators (such as Hertz) to manage these cars. Within the aftermarket sales, Icahn’s consolidation is working such that all auto-parts are bought from Federal-Mogul (parts manufacturer), the second-biggest after-market-parts seller in the US, also under Icahn’s control. This is a win-win situation for his companies and hurts the likes of O’Reilly (NASDAQ:ORLY) Automotive or AutoZone.
Recently, upping his bet, he has expanded further by acquiring four other companies in the last couple of years: Precision Auto Care (1000 repair shops), Just Brakes (auto repairs), BeckArnley (auto parts), and Auto Plus(service centers).
Individually, these acquired companies may not be hugely attractive, but collectively synergies are already being achieved, said the CEO of Icahn Automotive, Dan Ninivaggi,
Yet, Icahn is not the only one seeing value in investing in the automotive ecosystem. Since 2006, Amazon has expanded its automotive segment with Part Finder, Amazon Garage and most recently Amazon Vehicles. Mirroring Icahn’s ambition.
M&As usually are not accretive. However, we feel in PRTS’ case, potential acquirers, such as competitors or repair shops operators can work together. More importantly, the notion that Amazon’s rising automotive influence means that consolidation might be the only way to survival.
Suitable candidates
AutoZone has been suggested before as the potential suitor. While we agree, there is some logic to that. AutoZone’s online presence is still immaterial to its core business despite the company acquiring AutoAnything, an online retailer of auto parts since 2012. The latest quarter earnings call’s commentary shows progress has been limited and thus the company announced the sales of AutoAnything.
Also, AutoZone’s acquisition in the online space is not their top priority. Currently, AutoZone has almost $300M in cash and generates $1B of FCF annually. It sees more value in buying back its shares, which it has consistently executed since 1998, now totaled to $19.7B, and recently authorized an additional $1B of the buyback.
AutoZone may not be interested however there are many reasons why other competitors/repair shops operators should consider PRTS as an acquisition.
First, most auto parts or repair shop operators want to be the one-stop shop for customers. In the case of AutoZone, it wants to expand its product offering as its slogan allures customer to. The company can double its online sales, and acquire an additional 1M SKUs of parts just by acquiring PRTS.
AutoZone’s slogan
Secondly, a more efficient acquirer can unleash PRTS’ potential immensely. PRTS has a huge disadvantage in its economies of scale for fixed costs, volume discounts, and the ability to source parts directly from OEM instead of costlier U.S based wholesalers.
Thirdly, PRTS is trading at a fantastically cheap price for a buy-out!
Lastly, remember that nonsensical marketing costs of PRTS? The average marketing cost in this industry is about 7.5%, PRTS’ cost stood at 13% of sales as of Dec 30, 2017.
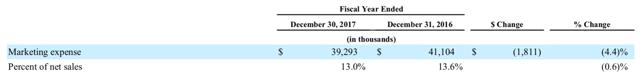 Source: PRTS 10K, 2017
Assuming PRTS’ potential acquirer has an industry average management and better brand name, half of PRTS operating costs can be slash. We are not proposing any specific numbers here, but coupled economies of scale, PRTS could achieve much higher net margins than the 1.5% it currently operates.
Takeaway
To summarize, an acquirer would benefit from PRTS’ 1M SKUs range (in several categories), the largest in the industry, and an established online channel. Lastly, despite PRTS operation inefficiencies, they are fixable.
Author's note: If you enjoyed our article, follow us to receive our latest investment opportunities. Lastly, please do additional due diligence and enjoy investing.
Disclosure: I am/we are long PRTS.
I wrote this article myself, and it expresses my own opinions. I am not receiving compensation for it (other than from Seeking Alpha). I have no business relationship with any company whose stock is mentioned in this article.
[/FONT]May. 1.18 | About: U.S. Auto (PRTS)
DTF Capital
Summary
This is the second part of US Auto Parts Network analysis.
Recent M&A activities hot up in the aftersales market.
US Auto Parts Network provides an established online channel for pure bricks-and-mortar competitors.
The company trading at a fantastically cheap price for a buy-out.
Although with operation inefficiencies, in better hands, this could be a great acquisition target.
This is the second part of the analysis of US Auto Parts Network Inc. (PRTS), it lays out a more speculative scenario where PRTS is proposed as a potential acquisition target. Please, read Part I for the background and fundamental analysis of the company.
PRTS as a potential acquisition target
Evaluating PRTS and the industry revealed to us that the company is, in fact, a great acquisition candidate. The main reasons are thanks to the highly active M&A activities in recent years, especially from a particular billionaire - Carl Icahn, and what PRTS can bring to the table. However, we need to remind investors that the opportunity that PRTS can be sold for a premium is purely speculative.
Recent M&A activities
As we have alluded to you in the first part of the analysis that even though new cars are coming in slower to the market, we must not forget that older cars are on the road for longer, and these owners are also spending more than ever to maximize the lifetime value of their vehicles. This rising demand for aftermarket parts and services is spurring new growth and revenue opportunities for a wide range of businesses operating in the automotive aftermarket industry.
The last few years saw many M&A activities. Most recently, Parts Authority, the US automotive and truck parts company agreed to acquire Interamerican Motor Corporation, a leader in European and Asian branded replacement parts, from AutoZone (NYSE:AZO) in February 2018. The deal allows Parts Authority to expand product offerings, customer touch points and geographies.
Elsewhere, Uni-Select and GPC also made acquisitions to bolster their product line and geography.
Then we also have one of PRTS’ competitors - Pep Boys (NYSE:PBY), which was almost bought out by Bridgestone in 2015, until Carl Icahn stepped in and outbid the Japanese tire company three times to acquire the company at the eventual price of $1.03B.
Arguably some of these acquisitions were hugely overvalued but those who have read about Carl Icahn, know that he is on a mission to build an automotive ecosystem that will counteract a dying culture of owning personal cars, opting instead for communal rideshares or short-term rentals.
He wants to sell cars to Uber and Lyft, then hires fleet operators (such as Hertz) to manage these cars. Within the aftermarket sales, Icahn’s consolidation is working such that all auto-parts are bought from Federal-Mogul (parts manufacturer), the second-biggest after-market-parts seller in the US, also under Icahn’s control. This is a win-win situation for his companies and hurts the likes of O’Reilly (NASDAQ:ORLY) Automotive or AutoZone.
Recently, upping his bet, he has expanded further by acquiring four other companies in the last couple of years: Precision Auto Care (1000 repair shops), Just Brakes (auto repairs), BeckArnley (auto parts), and Auto Plus(service centers).
Individually, these acquired companies may not be hugely attractive, but collectively synergies are already being achieved, said the CEO of Icahn Automotive, Dan Ninivaggi,
“He’s [Icahn] already linking his businesses. He arranged a partnership between Pep Boys and Hertz to locate 50 rental counters at the repair chain’s locations. Lyft drivers can lease a Hertz vehicle, and Pep Boys will inspect it and certify that it meets Lyft’s specifications. If the car needs repairs, the driver can take it to Pep Boys”
Source: Bloomberg
Yet, Icahn is not the only one seeing value in investing in the automotive ecosystem. Since 2006, Amazon has expanded its automotive segment with Part Finder, Amazon Garage and most recently Amazon Vehicles. Mirroring Icahn’s ambition.
M&As usually are not accretive. However, we feel in PRTS’ case, potential acquirers, such as competitors or repair shops operators can work together. More importantly, the notion that Amazon’s rising automotive influence means that consolidation might be the only way to survival.
Suitable candidates
AutoZone has been suggested before as the potential suitor. While we agree, there is some logic to that. AutoZone’s online presence is still immaterial to its core business despite the company acquiring AutoAnything, an online retailer of auto parts since 2012. The latest quarter earnings call’s commentary shows progress has been limited and thus the company announced the sales of AutoAnything.
“…We acquired AutoAnything to better understand the internet-only environment and to leverage those learnings on AutoZone.com. AutoAnything has always been run separate and distinct from AutoZone and AutoZone.com. Both the AutoAnything and AutoZone.com teams have learned from each other, but over time, as omnichannel has emerged and increased in importance, we've decided that our focus and efforts would be better spent focusing on AutoZone.com and driving our core business. This morning, we announced an agreement with Kingswood Capital who has purchased this business.”
Q2 – 2018 Earnings call (emphasis added)
Also, AutoZone’s acquisition in the online space is not their top priority. Currently, AutoZone has almost $300M in cash and generates $1B of FCF annually. It sees more value in buying back its shares, which it has consistently executed since 1998, now totaled to $19.7B, and recently authorized an additional $1B of the buyback.
AutoZone may not be interested however there are many reasons why other competitors/repair shops operators should consider PRTS as an acquisition.
First, most auto parts or repair shop operators want to be the one-stop shop for customers. In the case of AutoZone, it wants to expand its product offering as its slogan allures customer to. The company can double its online sales, and acquire an additional 1M SKUs of parts just by acquiring PRTS.
AutoZone’s slogan
Secondly, a more efficient acquirer can unleash PRTS’ potential immensely. PRTS has a huge disadvantage in its economies of scale for fixed costs, volume discounts, and the ability to source parts directly from OEM instead of costlier U.S based wholesalers.
Thirdly, PRTS is trading at a fantastically cheap price for a buy-out!
Lastly, remember that nonsensical marketing costs of PRTS? The average marketing cost in this industry is about 7.5%, PRTS’ cost stood at 13% of sales as of Dec 30, 2017.
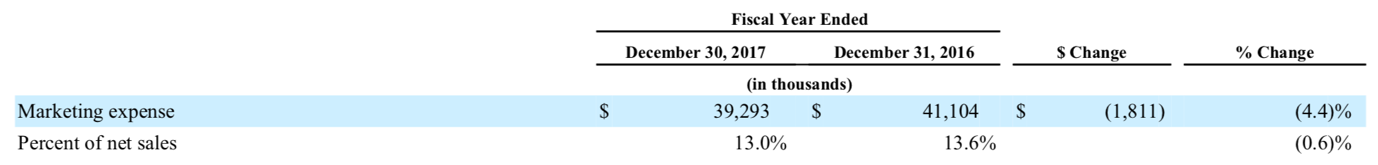 Source: PRTS 10K, 2017
Assuming PRTS’ potential acquirer has an industry average management and better brand name, half of PRTS operating costs can be slash. We are not proposing any specific numbers here, but coupled economies of scale, PRTS could achieve much higher net margins than the 1.5% it currently operates.
Takeaway
To summarize, an acquirer would benefit from PRTS’ 1M SKUs range (in several categories), the largest in the industry, and an established online channel. Lastly, despite PRTS operation inefficiencies, they are fixable.
Author's note: If you enjoyed our article, follow us to receive our latest investment opportunities. Lastly, please do additional due diligence and enjoy investing.
Disclosure: I am/we are long PRTS.
I wrote this article myself, and it expresses my own opinions. I am not receiving compensation for it (other than from Seeking Alpha). I have no business relationship with any company whose stock is mentioned in this article.
https://finance.yahoo.com/news/u-auto-parts-reports-first-200100530.html
First Quarter 2018 Financial Summary vs. Year-Ago Quarter
First Quarter 2018 Financial Summary vs. Year-Ago Quarter
- Net sales were $78.4 million compared to $80.8 million.
- Gross margin increased 50 basis points to 29.9%.
- Net income was $0.7 million, or $0.02 per diluted share, compared to $0.8 million or $0.02 per diluted share.
- Adjusted EBITDA (a non-GAAP measure defined below) was $4.1 million compared to $4.0 million.
- Ended the quarter with no revolver debt.
- Conversion rate increased 50 basis points to 2.3%.
- Customer acquisition cost reduced to $7.31.
- Revenue capture increased 300 basis points to 88.2%.
We are in the process of deploying similar initiatives across our other core e-commerce sites, and early results have been promising. In addition, we are continuing to expand our current marketplace partnerships and have made real progress on this front over the last month, with Amazon soon carrying some of our private label assortment under a direct fulfillment model. We are also working to create new relationships with marketplace partners, as we embrace the continued strong growth we've experienced in this sales channel. In fact, Q1 was our ninth consecutive quarter of double-digit marketplace sales growth."https://finance.yahoo.com/news/u-auto-parts-reports-first-200100530.html
First Quarter 2018 Financial Summary vs. Year-Ago Quarter
First Quarter 2018 Operational Highlights vs. Year-Ago Quarter
- Net sales were $78.4 million compared to $80.8 million.
- Gross margin increased 50 basis points to 29.9%.
- Net income was $0.7 million, or $0.02 per diluted share, compared to $0.8 million or $0.02 per diluted share.
- Adjusted EBITDA (a non-GAAP measure defined below) was $4.1 million compared to $4.0 million.
- Ended the quarter with no revolver debt.
- Conversion rate increased 50 basis points to 2.3%.
- Customer acquisition cost reduced to $7.31.
- Revenue capture increased 300 basis points to 88.2%.
[FONT=wf_segoe-ui_normal]US AUTO PARTS INC.[/FONT]
[FONT=wf_segoe-ui_normal]Pure "E-Commerce" retailer of=> AUTO PARTS [/FONT]
[FONT=wf_segoe-ui_normal]$300MM in Annual Sales[/FONT]
[FONT=wf_segoe-ui_normal]$63MM => MARKET CAP[/FONT]
[FONT=wf_segoe-ui_normal]+$14MM in EBITDA[/FONT]
[FONT=wf_segoe-ui_normal]$58MM in Brand New Inventory[/FONT]
[FONT=wf_segoe-ui_normal]$10MM in CASH[/FONT]
[FONT=wf_segoe-ui_normal]"ZERO" => DEBT[/FONT]
[FONT=wf_segoe-ui_normal]BUSINESS selling for approx => "ZERO" Enterprise Value[/FONT]


