Nate Silvers Latest 2016 Numbers

Search

Banned
Joined
Sep 21, 2004
Messages
15,948
Tokens
The Best in the Biz-I-Ness gives his final 2016 numbers. No one has been more accurate in the last 2 POTUS Elections, much to the consternation of the Usual Suspects.

Who will win the presidency?
Chance of winning


FiveThirtyEight
Hillary Clinton
72.2%
Donald Trump
27.7%


Electoral votes


Hillary Clinton
302.2
Donald Trump
235.0
Evan McMullin
0.8
Gary Johnson
0.0
Popular vote


Hillary Clinton
48.6%
Donald Trump
45.0%
Gary Johnson
4.8%
Other
1.6%

nate-silver-mad-bro.jpg
 

Banned
Joined
Sep 21, 2004
Messages
15,948
Tokens
NOV 8, 2016 AT 10:41 AM
[h=1]Final Election Update: There’s A Wide Range Of Outcomes, And Most Of Them Come Up Clinton[/h]
By Nate Silver
Filed under 2016 Election


finalartpresident-copy-7.jpg

Throughout the election, our forecast models have consistently come to two conclusions. First, that Hillary Clinton was more likely than not to become the next president. And second, that the range of possible Electoral College outcomes — including the chance of a Donald Trump victory, but also a Clinton landslide that could see her winning states such as Arizona — was comparatively wide.
That remains our outlook today in our final forecast of the year. Clinton is a 71 percent favorite to win the election according to our polls-only model and a 72 percent favorite according to our polls-plus model. (The models areessentially the same at this point, so they show about the same forecast.) This reflects a meaningful improvement for Clinton in the past 48 hours as the news cycle has taken a final half-twist in her favor. Her chances have increased from about 65 percent.
Our forecast has Clinton favored in states and congressional districts totaling 323 electoral votes, including all the states President Obama won in 2012 except Ohio and Iowa, but adding North Carolina. However, because our forecasts are probabilistic, and because Clinton’s leads in North Carolina and Florida especially are tenuous, the average number of electoral votes we forecast for Clinton is 302, which would be equivalent to her winning either Florida or North Carolina but not both.
Our forecast has Clinton winning the national popular vote by 3.6 percentage points, which is similar to her lead in recent national polls. Her chances of winning the popular vote are 81 percent, according to our forecast.
So what’s the source of all the uncertainty? And why does the same model[SUP]1[/SUP]that gave Mitt Romney only a 9 percent chance of winning the Electoral College on the eve of the 2012 election put Trump’s chances about three times higher — 28 percent — this year? It basically comes down to three things:

  • First, Clinton’s overall lead over Trump — while her gains over the past day or two have helped — is still within the range where a fairly ordinary polling error could eliminate it.
  • Second, the number of undecided and third-party voters is much higherthan in recent elections, which contributes to uncertainty.
  • Third, Clinton’s coalition — which relies increasingly on college-educated whites and Hispanics — is somewhat inefficiently configured for the Electoral College, because these voters are less likely to live in swing states. If the popular vote turns out to be a few percentage points closer than polls project it, Clinton will be an Electoral College underdog.
Let me briefly go into detail on each one of these points.
[h=2]Polls are good — but not perfect[/h]The track record of polling in American presidential elections is pretty good but a long way from perfect, and errors in the range of 3 percentage points have been somewhat common in the historical record. Of note, for instance, is that Obama beat his national polling average by nearly 3 points in 2012, although state polls did a better job of pegging his position. In 2000, Al Gore was behind by about 3 points in the final national polling average but won the popular vote. In 1996, Bill Clinton was ahead in national polls by about 12 points, but won by 8.5.
In three of the last five presidential elections, in other words, there was a polling error the size of which would approximately wipe out Clinton’s popular vote lead — or alternatively, if the error were in her favor, turn a solid victory into a near-landslide margin of 6 to 8 percentage points. There’s also some chance of a larger error still. In 1980, Ronald Reagan led in final national polls by slightly less than Clinton does now, but wound up winning the popular vote by almost 10 percentage points.
Three- or 4-point polling errors should also be familiar from other contexts. Republicans beat their polls by 3 or 4 percentage points, on average, in competitive Senate and gubernatorial races in the 2014 midterms. Brexit was about a 4-point polling error, and the error in the 2015 U.K. general election was larger — Conservatives’ margin over Labour was understated by about 6 percentage points. We often get annoyed when people express shock after outcomes like these occur — polling is a tricky business — only to expect polls to be infallible the next time around.
[h=2]Undecided voters contribute to uncertainty[/h]In our national polling average, about 12 percent of voters are either undecided or say they’ll vote for a third-party candidate. While this figure has declined over the past few weeks, it’s still much higher than in recent elections. Just 3 percent of voters were undecided at the end of the 2012 race, for example, according to RealClearPolitics. Clinton’s share of the vote — about 46 percent in national polls — is low for a leading candidate, and Trump’s share of 42 percent is the lowest of any candidate since Bob Dole in 1996.
FINAL NATIONAL POLLING AVERAGE
YEARDEM CANDIDATEGOP CANDIDATEUNDECIDED/OTHER
2000Gore43.6%Bush46.8%Undecided/other9.6%
2004Kerry47.4Bush48.9Undecided/other3.7
2008Obama52.1McCain44.5Undecided/other3.4
2012Obama48.8Romney48.1Undecided/other3.1
2016Clinton45.7Trump41.8Undecided/other12.5

There are far more undecided voters this year
SOURCE: REALCLEARPOLITICS (2000-2012), FIVETHIRTYEIGHT POLLS-ONLY MODEL (2016)
As ought to be fairly intuitive, undecided voters make for a more uncertain outcome. If two-thirds of undecideds were to break for Trump, for instance, the candidates would tie in the popular vote at almost 50-50. If Clinton were to win undecideds by that margin, she’d claim a 7- or 8- point popular vote victory. Granted, these outcomes are not totally realistic, given that the third-party candidates will get at least some votes. But a candidate polling at just 46 percent of the vote can’t take her victory for granted, and one polling at 42 percent is at risk of a blowout if late-deciding voters move against him.
Undecided voters contribute significantly to uncertainty in the FiveThirtyEight forecast. If there were half as many undecideds — in line with recent past elections but still more than in 2012 — Clinton’s chances of winning the Electoral College would rise to 78 percent in our forecast, and her chances of winning the popular vote would be 89 percent, higher than Obama’s were in our final 2012 forecast.
[h=2]Polling errors are correlated across states — and could put Clinton at risk or put red states in play[/h]By definition, if Trump or Clinton beat their polls by 3 points nationally, they’ll also do so by 3 points in the average state.[SUP]2[/SUP] If anything, in fact, the gain might be larger than that in the average swing state because swing states tend to have more swing voters than non-swing states do. (In FiveThirtyEight parlance, they’re more elastic — more responsive to changes in national trends.) Here, for example, is how our polls-only model shows the swing states lining up if the polls are exactly right, if there’s a 3-point error in Clinton’s favor, or if there’s a 3-point error in Trump’s favor.
CLINTON’S PROJECTED MARGIN
STATEPOLLS-ONLY FORECASTWITH 3-POINT NATIONAL ERROR IN CLINTON’S FAVORWITH 3-POINT NATIONAL ERROR IN TRUMP’S FAVOR
Maine+7.4+10.9+4.0
Minnesota+5.8+8.9+2.7
New Mexico+5.8+8.9+2.7
Virginia+5.6+8.5+2.7
Wisconsin+5.3+8.4+2.2
Michigan+4.2+7.2+1.2
Colorado+4.0+7.2+0.9
Pennsylvania+3.7+6.6+0.8
New Hampshire+3.6+7.1+0.0
Nevada+1.2+4.2-1.8
North Carolina+0.7+3.5-2.1
Florida+0.7+3.6-2.3
Maine CD-2+0.4+3.7-3.0
Nebraska CD-2-1.8+1.2-4.7
Ohio-1.9+1.1-4.9
Arizona-2.2+0.8-5.3
Iowa-2.9+0.3-6.1
Georgia-4.0-1.4-6.7
South Carolina-7.0-4.3-9.6
Alaska-7.4-4.2-10.7

How state forecasts would change if polls are slightly off
If there’s a 3-point error in Clinton’s favor, she’d be a heavy favorite to win Florida and North Carolina, and she would probably also flip Ohio, Arizona, Nebraska’s 2nd Congressional District and possibly Iowa to her column. Georgia would be highly competitive. Clinton would probably need a Reagan-in-1980 polling error in her favor — and not a mere ordinary polling error — to put states beyond Georgia in play, although there are some wild cards such as Utah and Alaska that could be competitive.
But if there’s a 3-point error against Clinton? That would still leave her with a narrow lead over Trump in the popular vote — by about the margin by which Gore beat Bush in 2000. But New Hampshire, which is currently the tipping-point state, would be exactly tied. Meanwhile, Clinton’s projected margin in Michigan, Pennsylvania and Colorado would shrink to about 1 percentage point, while Trump would be about 2 points ahead in Florida and North Carolina. It’s certainly not impossible that Clinton could win under those circumstances — her turnout operation might come in really handy — but she doesn’t have the Electoral College advantage that Obama did in 2012, when he led in states such as Ohio and Iowa and had larger leads than Clinton does in Michigan and Pennsylvania. In particular, Clinton could be vulnerable to a slump in African-American turnout.
[h=3]Related: ELECTIONS PODCAST[/h][h=2]Elections Podcast Countdown: Final Election Preview[/h]


Despite what you might think, we haven’t been trying to scare anyone with these updates. The goal of a probabilistic model is not to provide deterministic predictions (“Clinton will win Wisconsin”) but instead to provide an assessment of probabilities and risks. In 2012, the risks to to Obama were lower than was commonly acknowledged, because of the low number of undecided voters and his unusually robust polling in swing states. In 2016, just the opposite is true: There are lots of undecideds, and Clinton’s polling leads are somewhat thin in swing states. Nonetheless, Clinton is probably going to win, and she could win by a big margin.

[h=2]VIDEO: Nate Silver discusses the final presidential forecast[/h]
i


Nate Silver is the founder and editor in chief of FiveThirtyEight. @natesilver538
 

Member
Joined
Dec 12, 2006
Messages
16,073
Tokens
:nohead:
 

Underground
Joined
Sep 20, 2006
Messages
2,930
Tokens
Only one Poll stayed consistent with Trump ahead.
LA Times/USC was the most accurate and unbiased.
Other Polls should take note.
 

Conservatives, Patriots & Huskies return to glory
Handicapper
Joined
Sep 9, 2005
Messages
87,121
Tokens
forgetaboutit
 

RX Member
Joined
Sep 21, 2004
Messages
16,391
Tokens
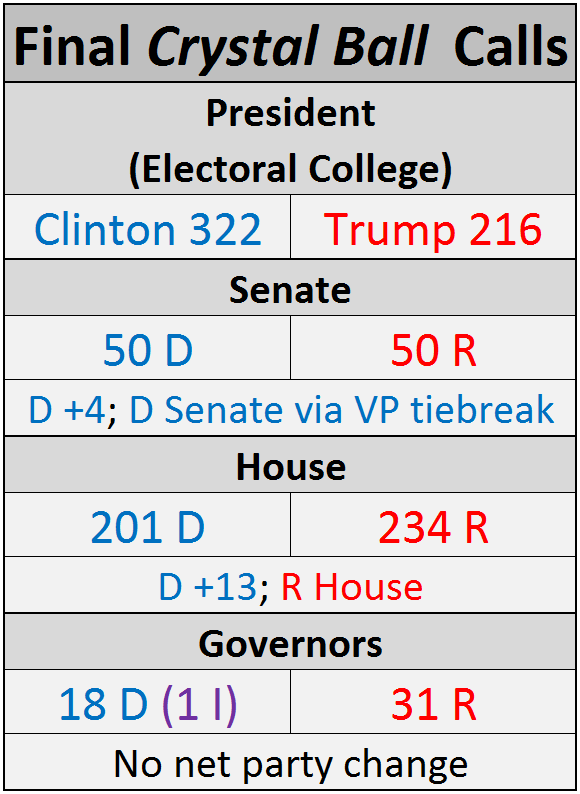
You ain't whistlin' Dixie, 322 was MY prediction, now, like Chazz Palmeri seeing "Mush" having the same horse he did in "Bronx Tale," I'm feeling uneasy...:ohno:face)(*^%:think2::scared1:


Did somebody say Mush ? Aren't you from the Bronx ? @):mad::pointer: kth)(&^

A year ago at this time is when you went into hiding cockroach . Loser!@#0
 

Member
Joined
Apr 14, 2006
Messages
26,039
Tokens
 

Conservatives, Patriots & Huskies return to glory
Handicapper
Joined
Sep 9, 2005
Messages
87,121
Tokens
The Best in the Biz-I-Ness gives his final 2016 numbers. No one has been more accurate in the last 2 POTUS Elections, much to the consternation of the Usual Suspects.

Who will win the presidency?
Chance of winning


FiveThirtyEight
Hillary Clinton
72.2%
Donald Trump
27.7%


Electoral votes


Hillary Clinton
302.2
Donald Trump
235.0
Evan McMullin
0.8
Gary Johnson
0.0
Popular vote


Hillary Clinton
48.6%
Donald Trump
45.0%
Gary Johnson
4.8%
Other
1.6%

nate-silver-mad-bro.jpg


oh the irony, I still laugh at this idiocy
 

Conservatives, Patriots & Huskies return to glory
Handicapper
Joined
Sep 9, 2005
Messages
87,121
Tokens

Conservatives, Patriots & Huskies return to glory
Handicapper
Joined
Sep 9, 2005
Messages
87,121
Tokens
"it's simple math", another idiocy exposed
 

Forum statistics

Threads
1,119,827
Messages
13,573,606
Members
100,877
Latest member
kiemt5385
The RX is the sports betting industry's leading information portal for bonuses, picks, and sportsbook reviews. Find the best deals offered by a sportsbook in your state and browse our free picks section.FacebookTwitterInstagramContact Usforum@therx.com